KPI Documentation
Technical documentation for environmental indicators used in the ILoveNatura platform
Filter by iLoveNatura plan
Climate
Pollution
Water
Biodiversity
Risks
Monitoring
247 indicators found
Maps
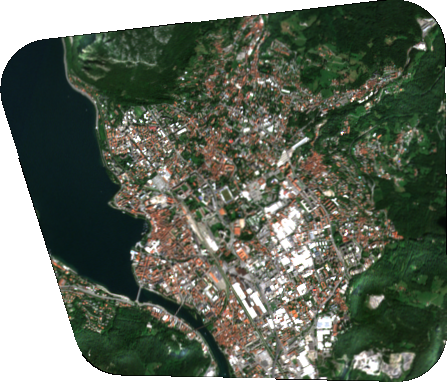
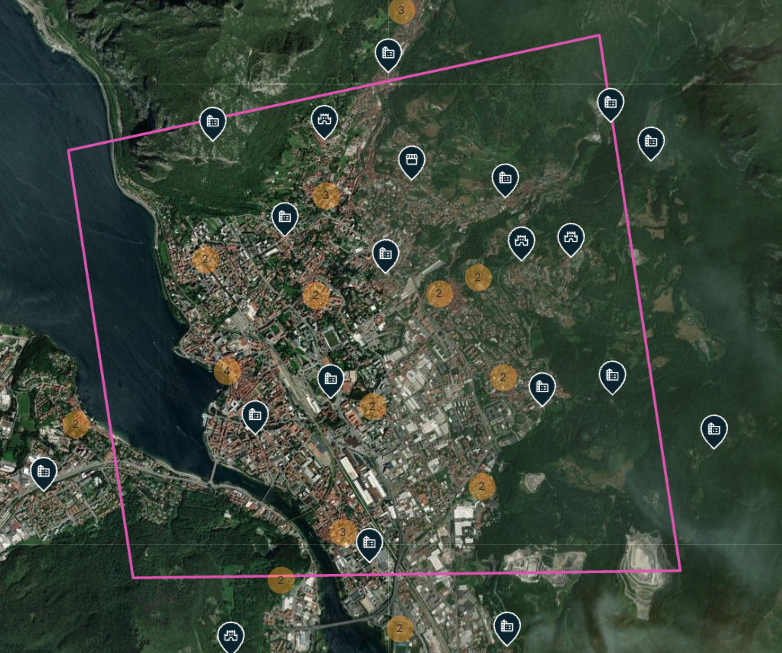
RGB satellite imagery
RGB satellite imagery
2.00 credits/per_km2rgb
Documentation
Maps
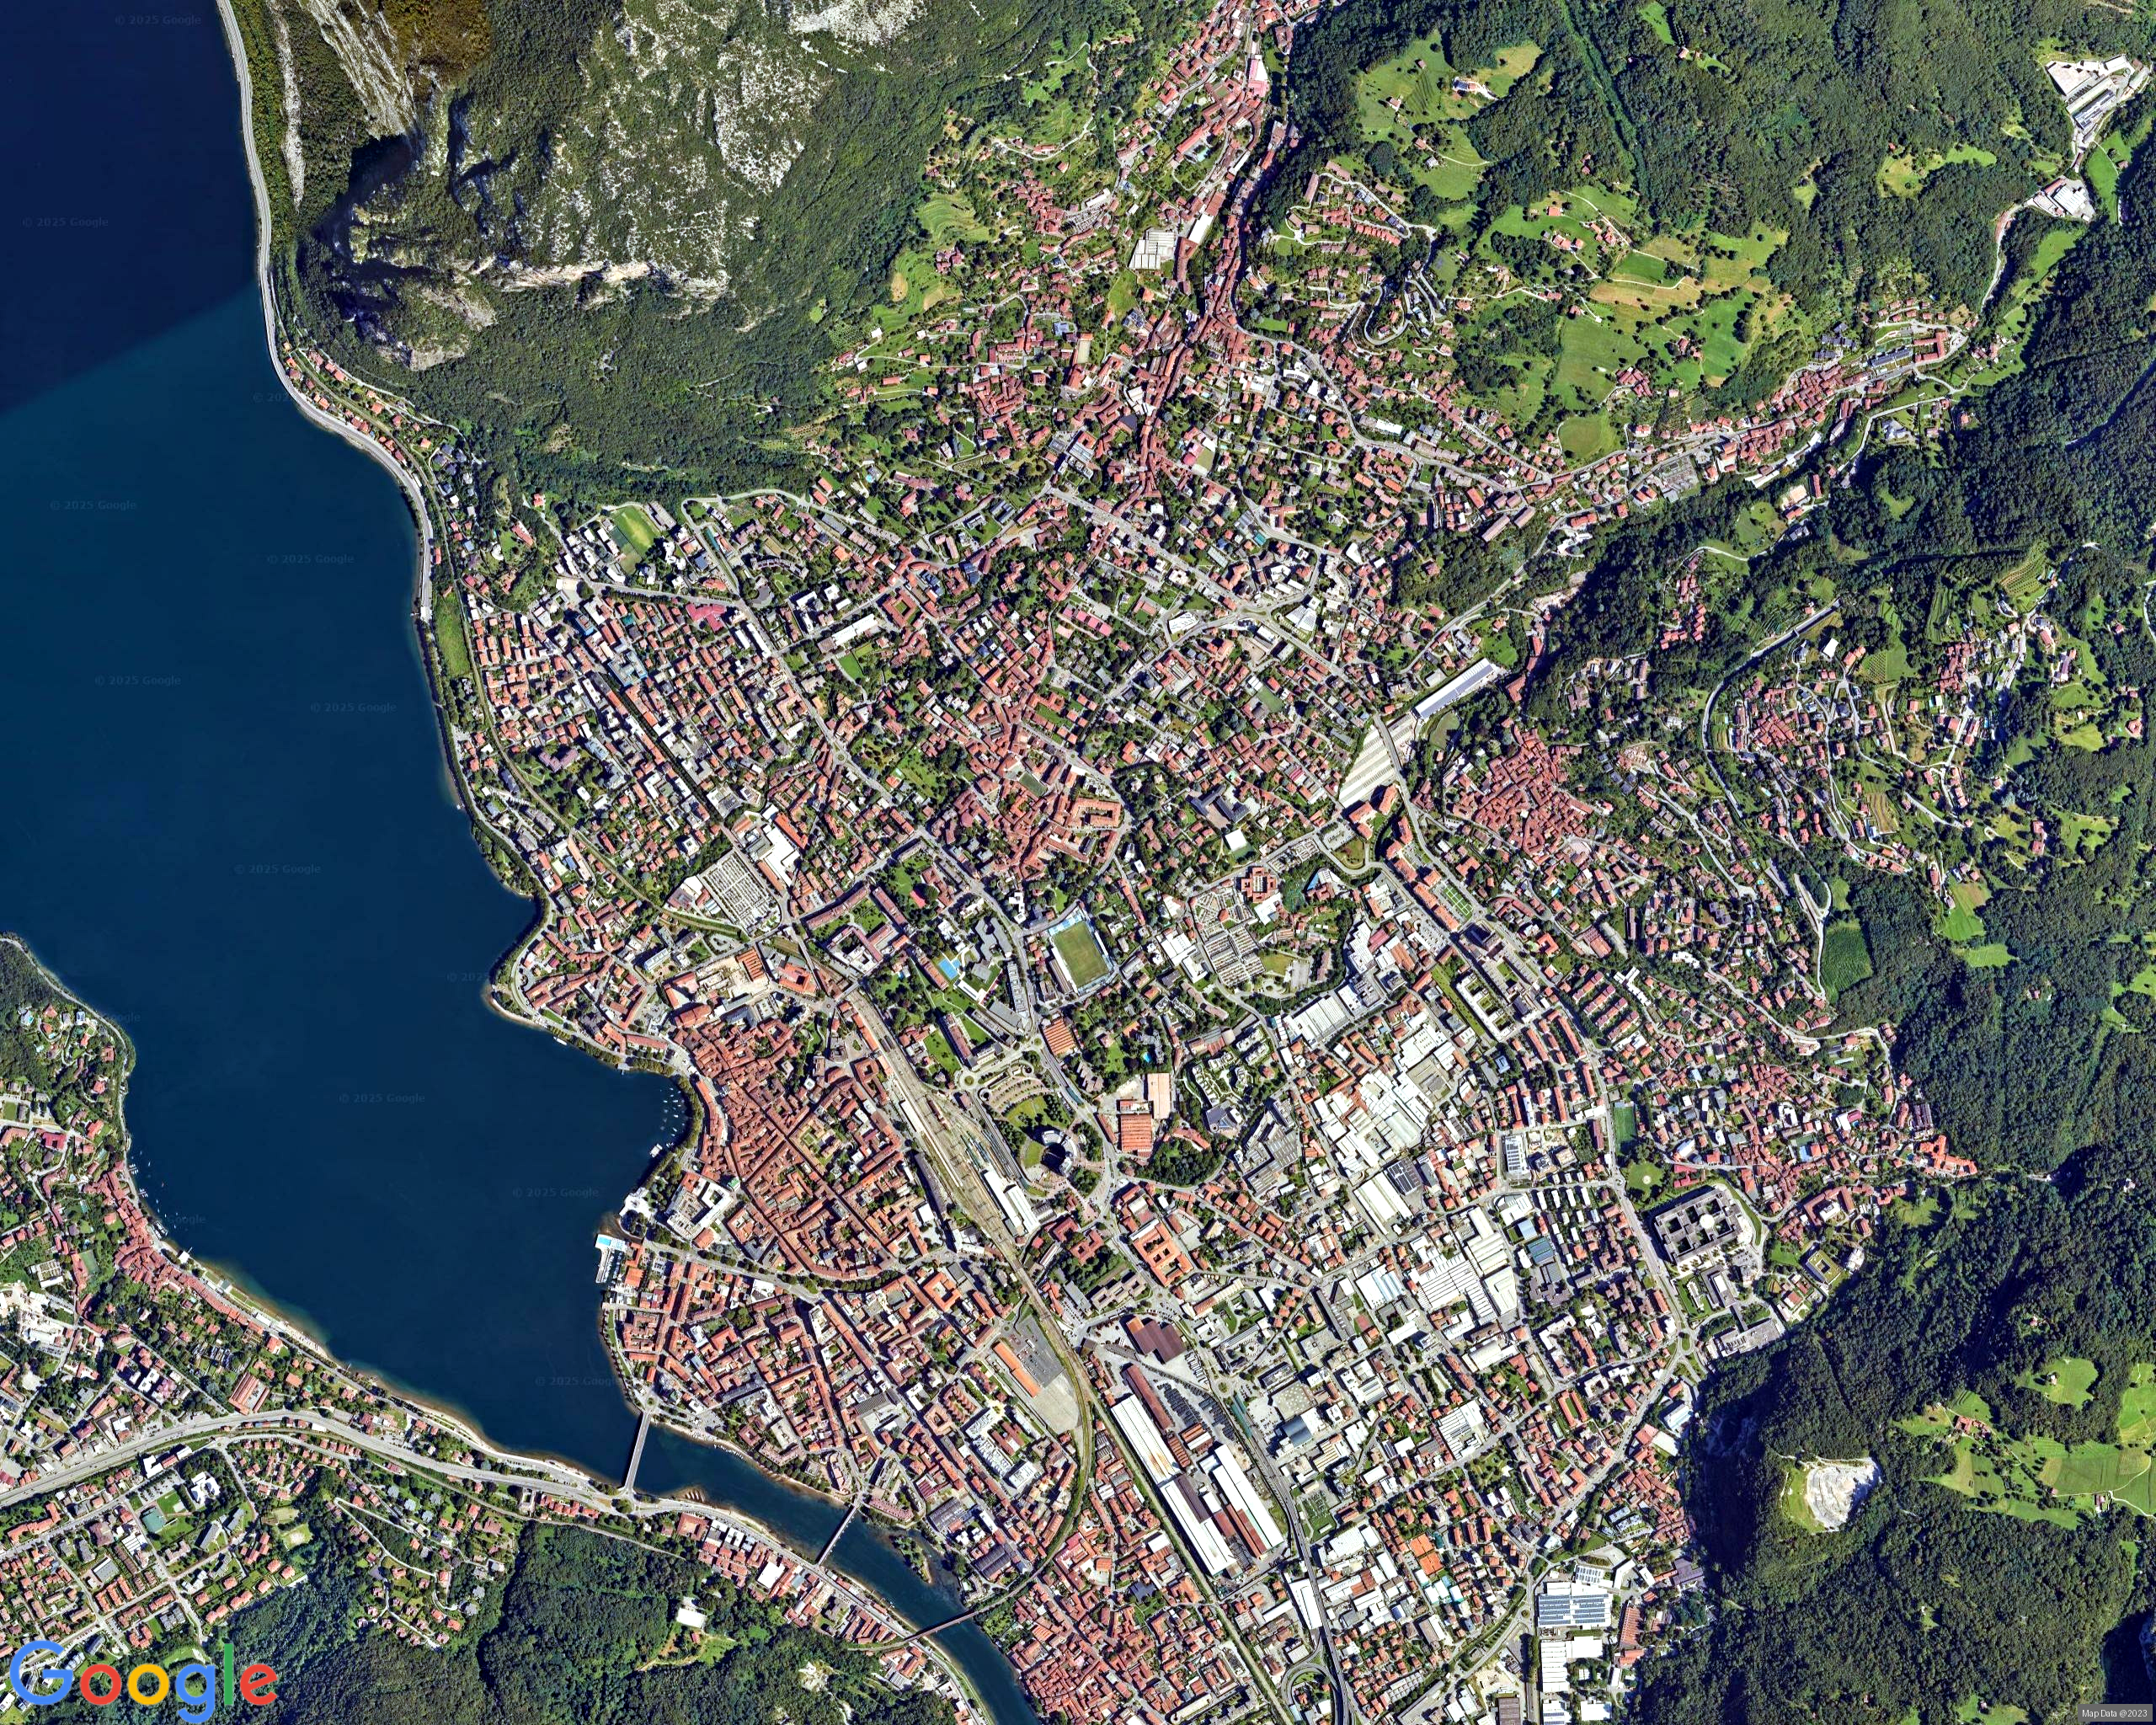
High resolution RGB imagery
High resolution RGB imagery
8.00 credits/per_km2rgb_high_res
Documentation
Maps
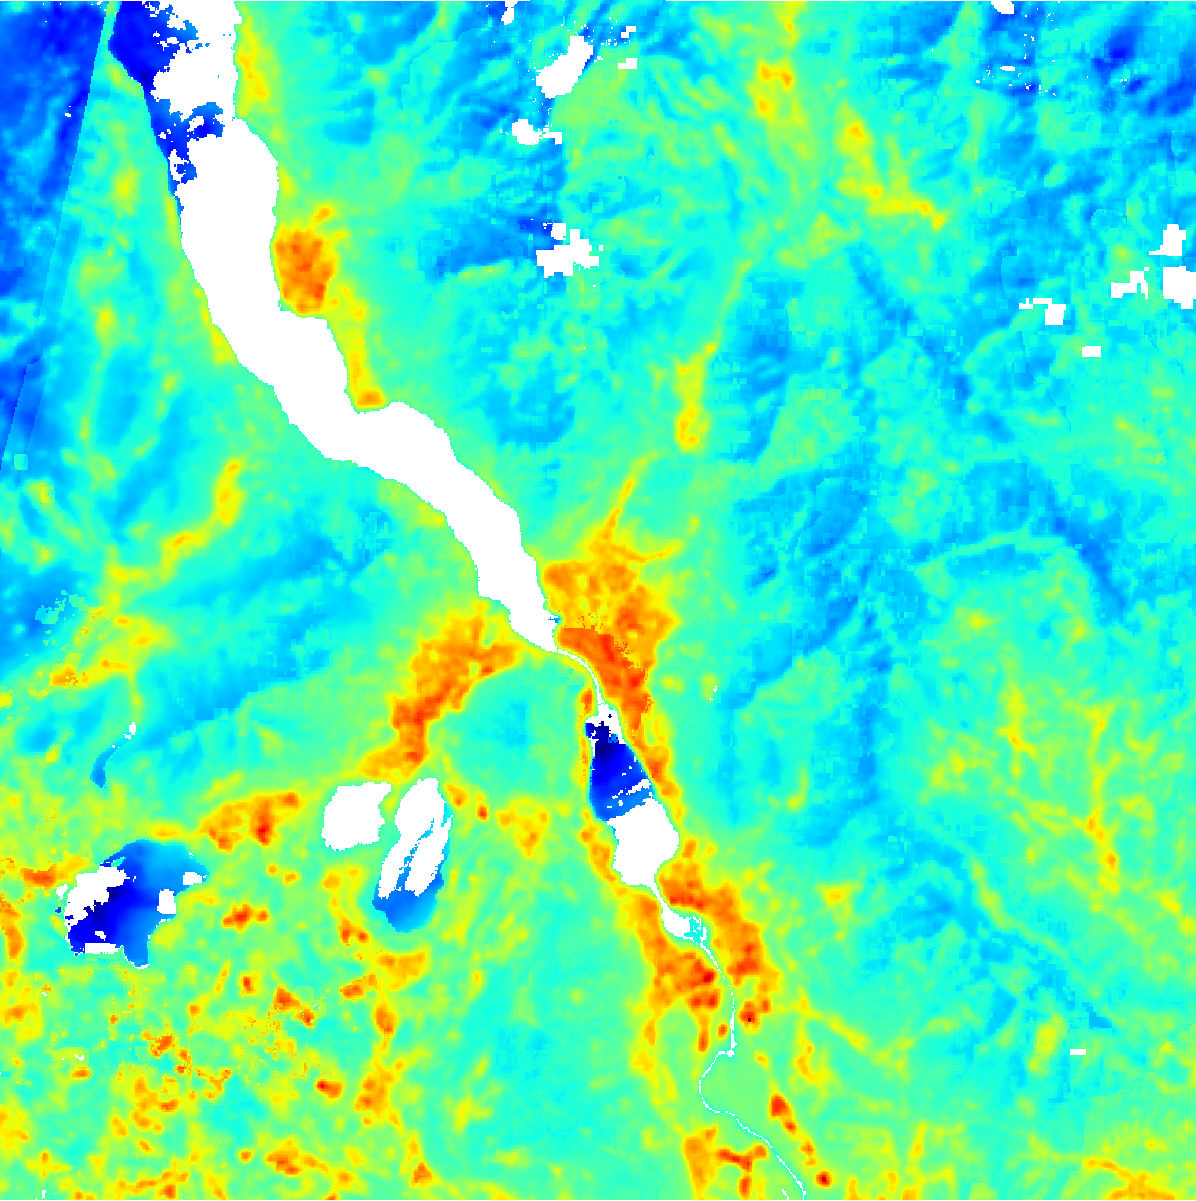
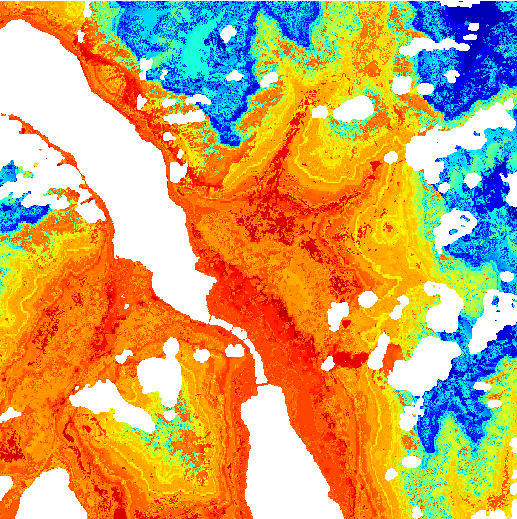
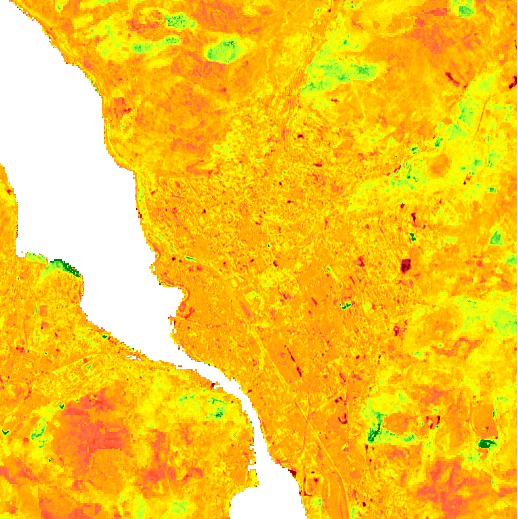
Land Surface Temperature
Land Surface Temperature
3.00 credits/per_km2lst
Documentation
Maps
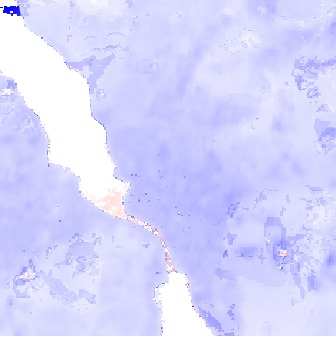
LST annual range
Annual mean of each pixel over the selected period
15.00 credits/per_km2lst_range
Documentation
Maps
LST range delta between years
Difference between the annual mean of each pixel in two distinct periods
15.00 credits/per_km2lst_range_delta
Documentation
Maps
Night Land Surface Temperature
Night Land Surface Temperature
3.00 credits/per_km2night_lst
Documentation
Maps
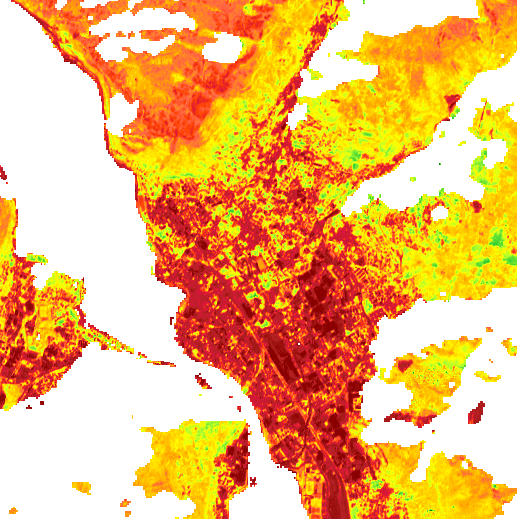
Urban Thermal Field Variance Index
Urban Thermal Field Variance Index
4.00 credits/per_km2utfvi
Documentation
Maps
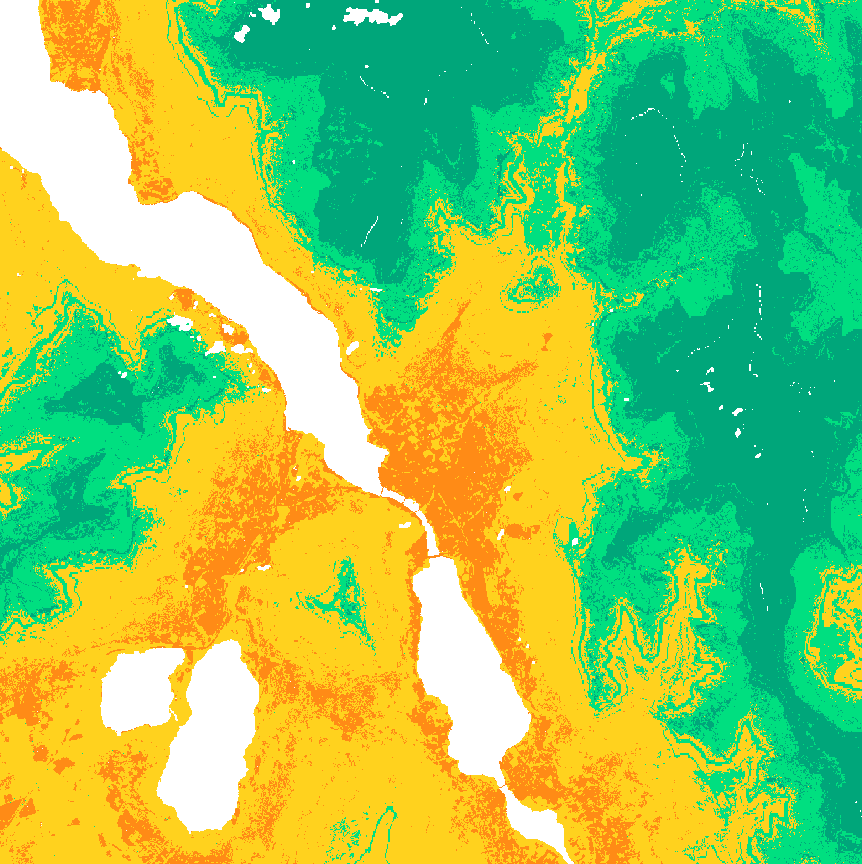
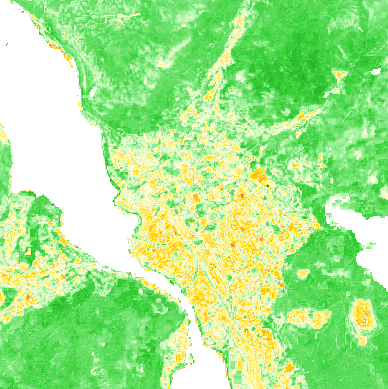
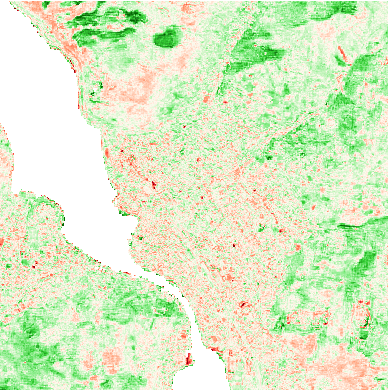
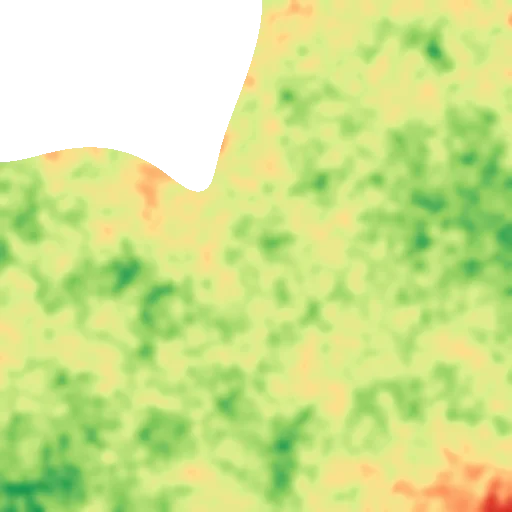
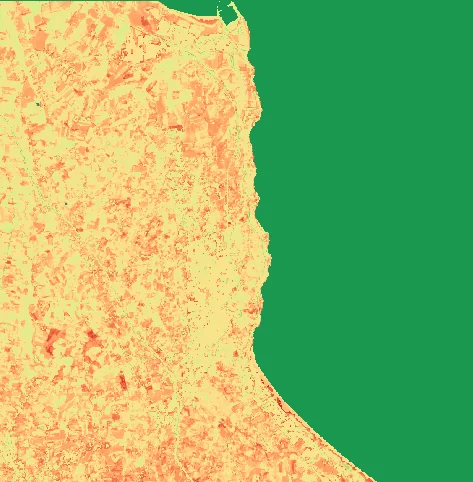
Normalized Difference Vegetation Index
Normalized Difference Vegetation Index
4.00 credits/per_km2ndvi
Documentation
Maps
NDVI annual range
Annual mean of each pixel over the selected period
5.00 credits/per_km2ndvi_range
Documentation
Maps
NDVI range delta between years
Difference between the annual mean of each pixel in two distinct periods
6.00 credits/per_km2ndvi_range_delta
Documentation
Maps
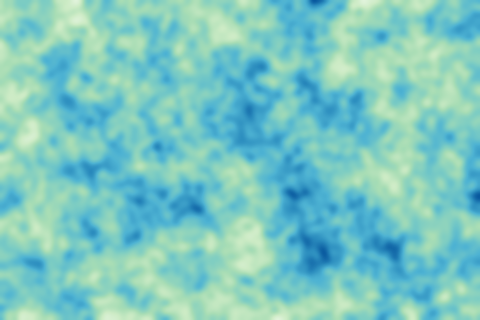
Normalized Difference Water Index
Normalized Difference Water Index
4.00 credits/per_km2ndwi
Documentation
Maps
NDWI annual range
Annual mean of each pixel over the selected period
5.00 credits/per_km2ndwi_range
Documentation
Maps
NDWI range delta between years
Difference between the annual mean of each pixel in two distinct periods
6.00 credits/per_km2ndwi_range_delta
Documentation
Maps
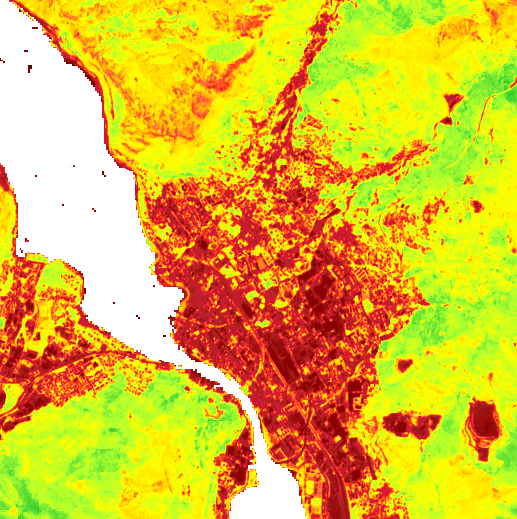
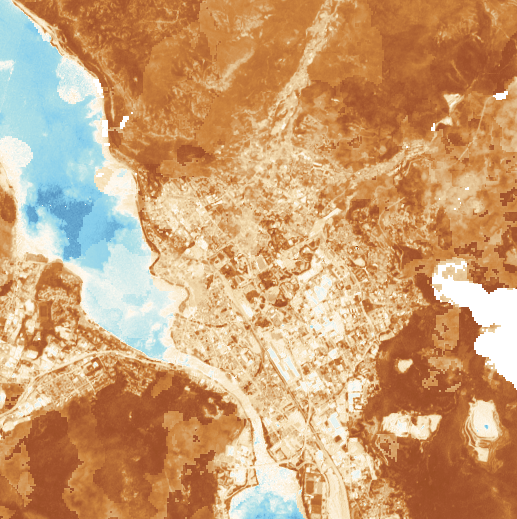
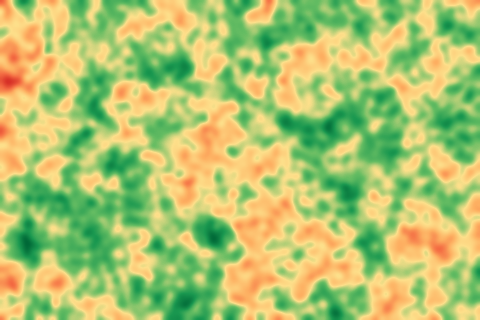
Normalized Difference Moisture Index
Normalized Difference Moisture Index
4.00 credits/per_km2ndmi
Documentation
Maps
NDMI annual range
Annual mean of each pixel over the selected period
5.00 credits/per_km2ndmi_range
Documentation
Maps
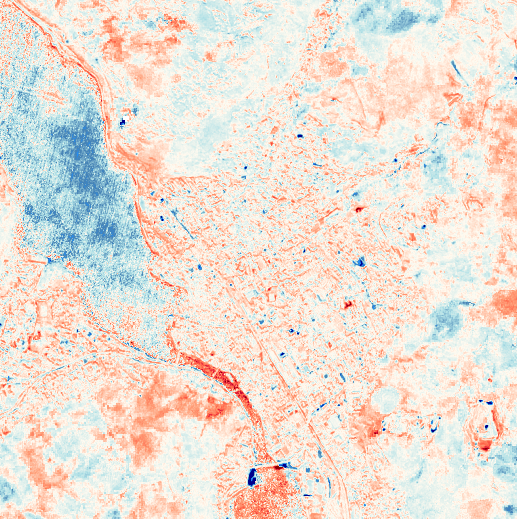
NDMI range delta between years
Difference between the annual mean of each pixel in two distinct periods
6.00 credits/per_km2ndmi_range_delta
Documentation

Maps
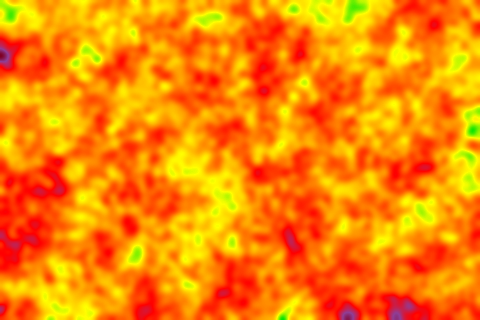
Artificial light intensity
Artificial light intensity
3.00 credits/per_km2light_pollution
Documentation
Maps
Light pollution annual range
Annual mean of each pixel over the selected period
4.00 credits/per_km2light_pollution_range
Documentation
Maps
Light pollution range delta
Difference between the annual mean of each pixel in two distinct periods
5.00 credits/per_km2light_pollution_range_delta
Documentation
Maps
Built-up Surface Fraction
Built-up Surface Fraction
3.00 credits/per_km2busf
Documentation

Maps
Population Density
Population Density
3.00 credits/per_km2pd
Documentation

Maps
Aridity
Aridity index based on the ratio of precipitation to evapotranspiration
1.00 credits/per_km2aridity
Documentation

Maps
Hydrogeological flood risk
Hydrogeological flood risk
4.00 credits/per_km2flood_risk
Documentation

Maps
Evapotranspiration
Evapotranspiration
3.00 credits/per_km2et
Documentation

Maps
Degree of Urbanization
Degree of Urbanization
3.00 credits/per_km2du
Documentation
Maps
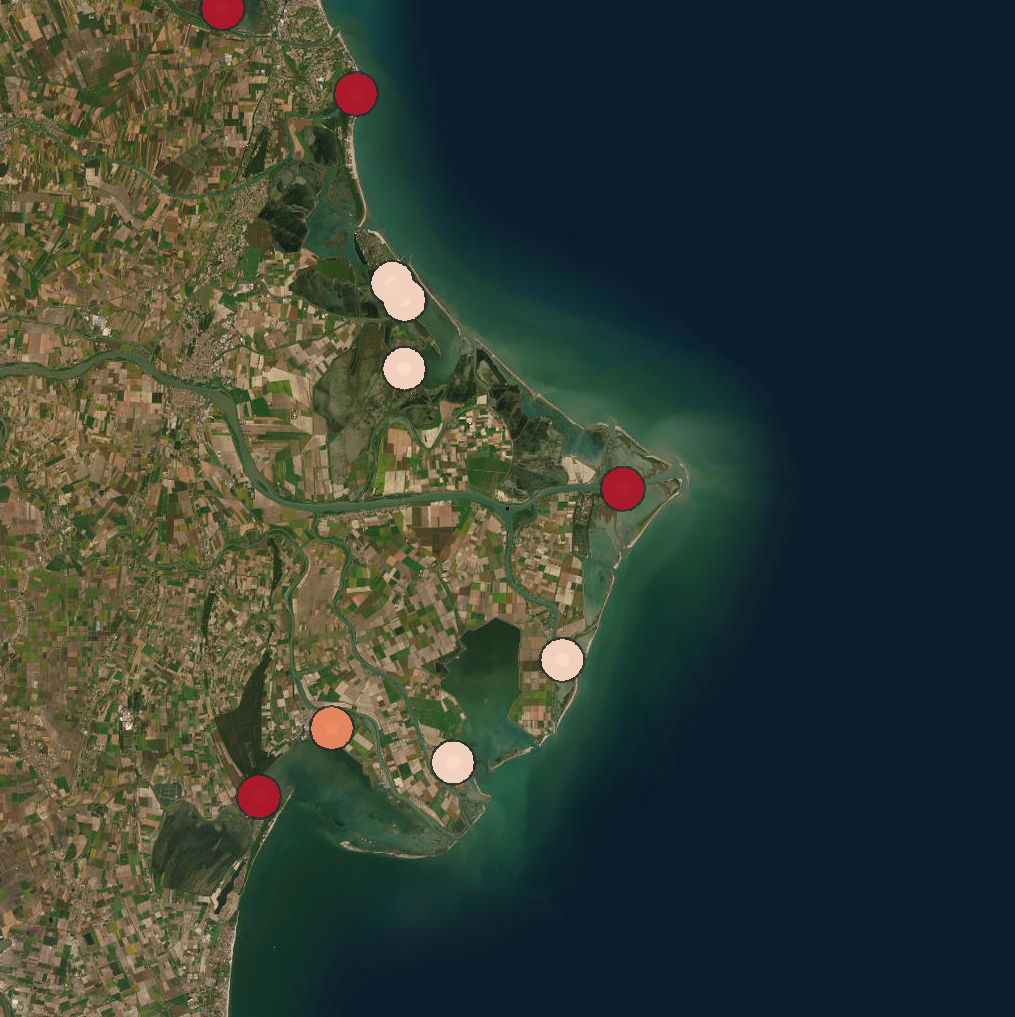
Protected natural areas
Protected natural areas
2.00 credits/protected_areas
Documentation
Maps
European ecosystems classification
European ecosystems classification
0.20 credits/per_km2eu_ecosystems
Documentation
Maps
Wildlife corridors
Wildlife corridors
0.50 credits/per_km2ecological_corridors
Documentation
Maps
Stepping stone habitats
Stepping stone habitats
0.50 credits/per_km2stepping_zones
Documentation
Maps
Ecological transition areas
Ecological transition areas
0.50 credits/per_km2transition_areas
Documentation

Maps
Carbon stock overview
Carbon stock overview
6.00 credits/per_km2carbon_stock
Documentation
Maps
Current above-ground biomass carbon
Current above-ground biomass carbon
6.00 credits/per_km2carbon_stock_current_agb
Documentation

Maps
Current below-ground biomass carbon
Current below-ground biomass carbon
6.00 credits/per_km2carbon_stock_current_bgb
Documentation

Maps
Current total biomass carbon
Current total biomass carbon
6.00 credits/per_km2carbon_stock_current_agb_bgb
Documentation

Maps
Current soil organic carbon
Current soil organic carbon
6.00 credits/per_km2carbon_stock_current_soc
Documentation

Maps
Current total carbon stock
Current total carbon stock
8.00 credits/per_km2carbon_stock_current_total
Documentation

Maps
Unrealized AGB carbon potential
Unrealized AGB carbon potential
8.00 credits/per_km2carbon_stock_unrealized_potential_agb
Documentation

Maps
Unrealized BGB carbon potential
Unrealized BGB carbon potential
8.00 credits/per_km2carbon_stock_unrealized_potential_bgb
Documentation

Maps
Unrealized biomass carbon potential
Unrealized biomass carbon potential
8.00 credits/per_km2carbon_stock_unrealized_potential_agb_bgb
Documentation

Maps
Unrealized SOC potential
Unrealized SOC potential
8.00 credits/per_km2carbon_stock_unrealized_potential_soc
Documentation

Maps
Unrealized total carbon potential
Unrealized total carbon potential
10.00 credits/per_km2carbon_stock_unrealized_potential_total
Documentation

Maps
Future unrealized carbon potential
Future unrealized carbon potential
10.00 credits/per_km2carbon_stock_future_unrealized_potential
Documentation

Maps
Future carbon potential change
Future carbon potential change
10.00 credits/per_km2carbon_stock_future_unrealized_potential_change
Documentation
Maps
Active fire detection
Active fire detection
3.00 credits/per_km2active_fire
Documentation
Maps
Socioeconomic indicators
Socioeconomic indicators
2.00 credits/per_km2socioeconomic
Documentation

Maps
Harmonized World Soil Database
Harmonized World Soil Database
2.00 credits/per_km2hwsd
Documentation
Maps
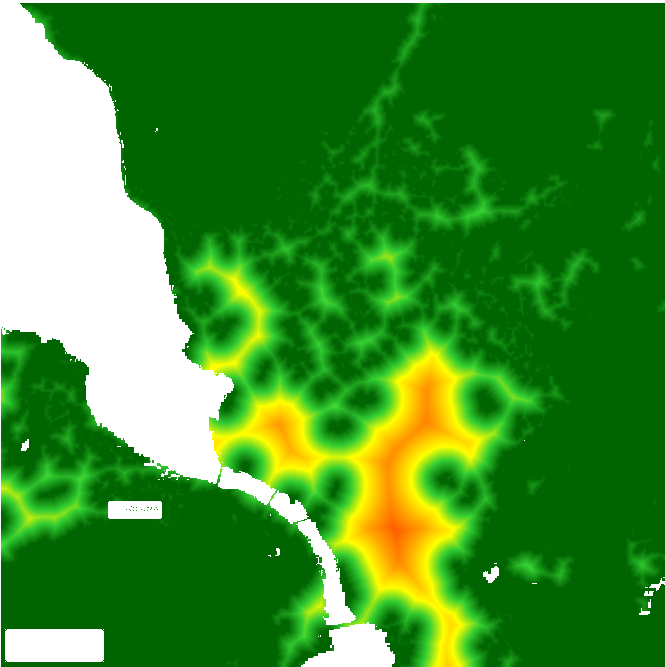
Distance to green areas
Distance to green areas
3.00 credits/per_km2distance_to_green
Documentation
Maps
Distance to small gardens
Distance to small gardens
3.00 credits/per_km2distance_to_small_gardens
Documentation
Maps
Distance to parks
Distance to parks
3.00 credits/per_km2distance_to_parks
Documentation
Maps
Carbon Monoxide
Carbon monoxide (CO) concentration analysis over time
1.00 credits/per_km2carbon_monoxide
Documentation
Maps
Formaldehyde concentration
Formaldehyde concentration
3.00 credits/per_km2formaldehyde
Documentation

Maps
Methane
Methane (CH4) concentration analysis over time
1.00 credits/per_km2methane
Documentation
Maps
Nitrogen Dioxide
Nitrogen dioxide (NO2) concentration analysis over time
1.00 credits/per_km2nitrogen_dioxide
Documentation
Maps
Ozone
Ozone (O3) concentration analysis over time
1.00 credits/per_km2ozone
Documentation

Maps
Sulfur dioxide concentration
Sulfur dioxide concentration
3.00 credits/per_km2sulfur_dioxide
Documentation

Maps
UV aerosol index
UV aerosol index
3.00 credits/per_km2uv_aerosol_index
Documentation

Maps
Fertilizer pollution overview
Fertilizer pollution overview
3.00 credits/per_km2fertilizer_pollution
Documentation
Maps
Nitrogen fertilizer pollution
Nitrogen fertilizer pollution
3.00 credits/per_km2fertilizer_pollution_n
Documentation

Maps
Phosphorus fertilizer pollution
Phosphorus fertilizer pollution
3.00 credits/per_km2fertilizer_pollution_p
Documentation

Maps
Potassium fertilizer pollution
Potassium fertilizer pollution
3.00 credits/per_km2fertilizer_pollution_k
Documentation

Maps
Toxic metals soil pollution
Toxic metals soil pollution
4.00 credits/per_km2toxic_metals_soil_pollution
Documentation
Maps
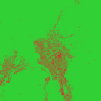
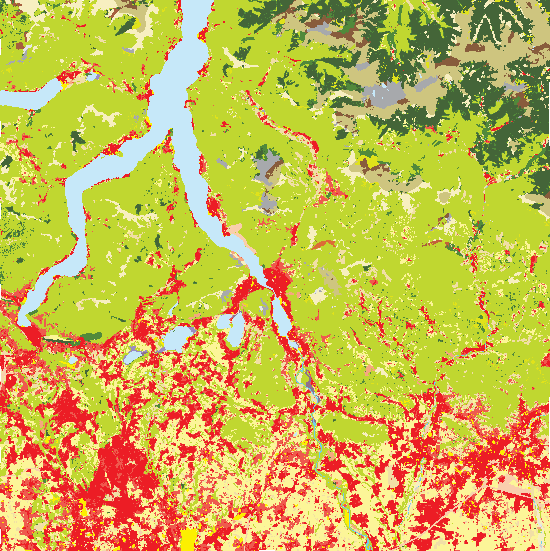
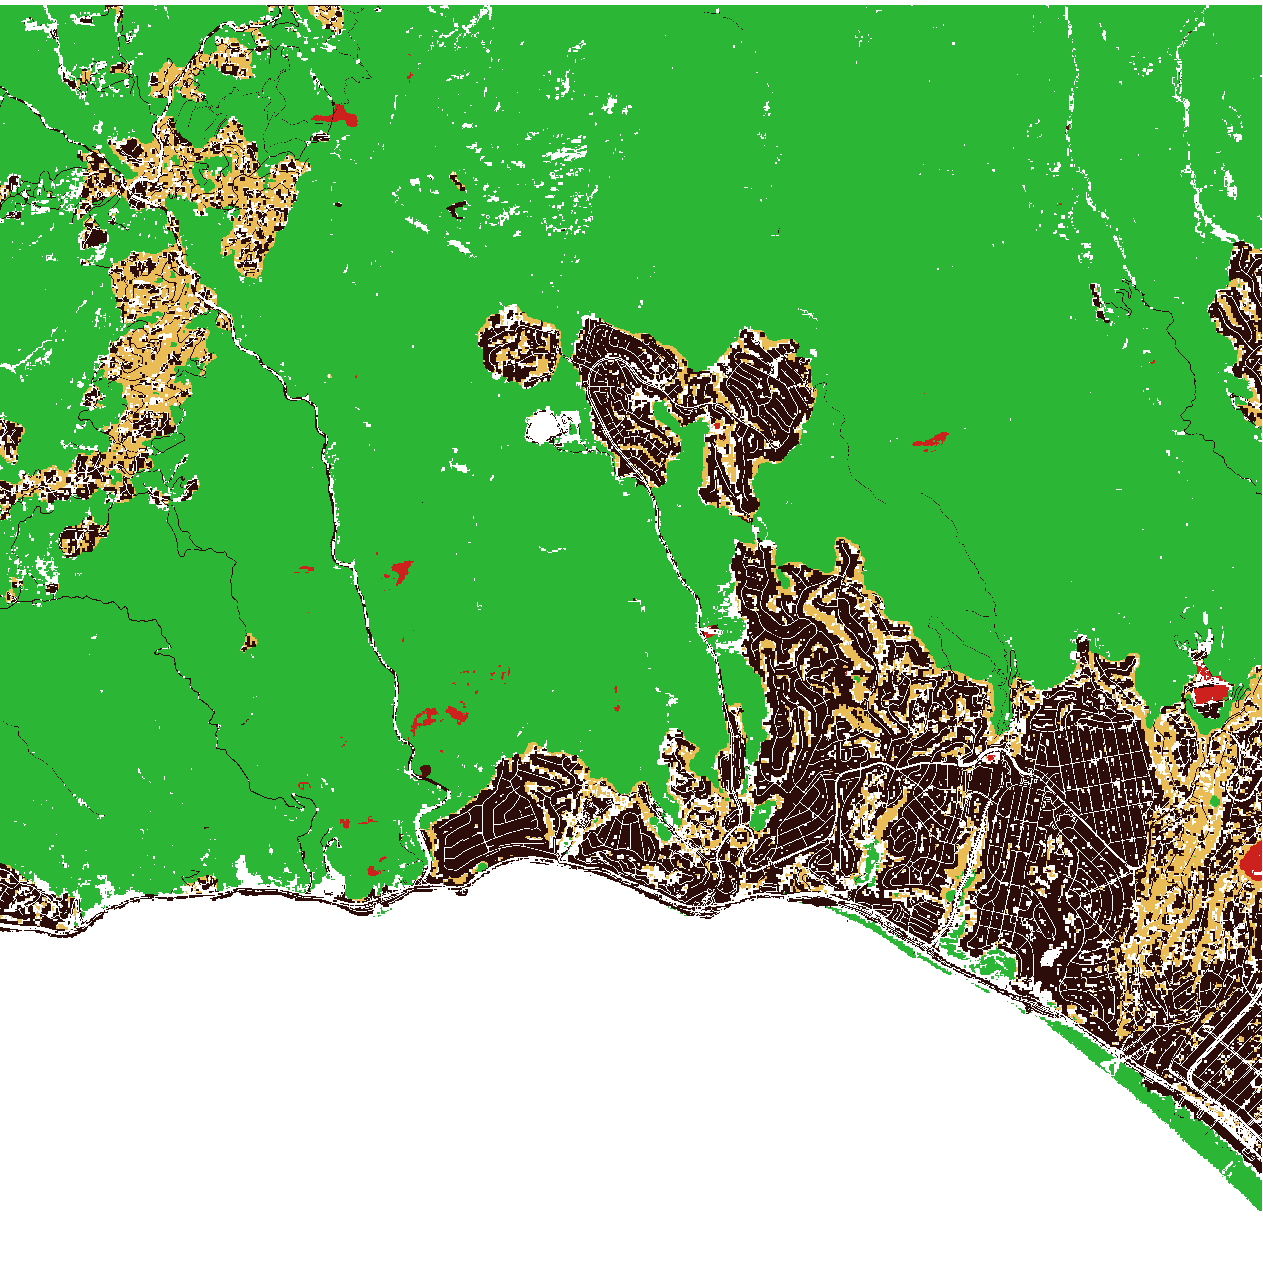
Land Cover Classification
CLC computation prerequisite for biodiversity maps (MSA, PA, NS, NP, FA)
0.10 credits/per_km2clc
Documentation
Maps
Soil impermeability
Soil impermeability
0.10 credits/per_km2impermeability
Documentation
Maps
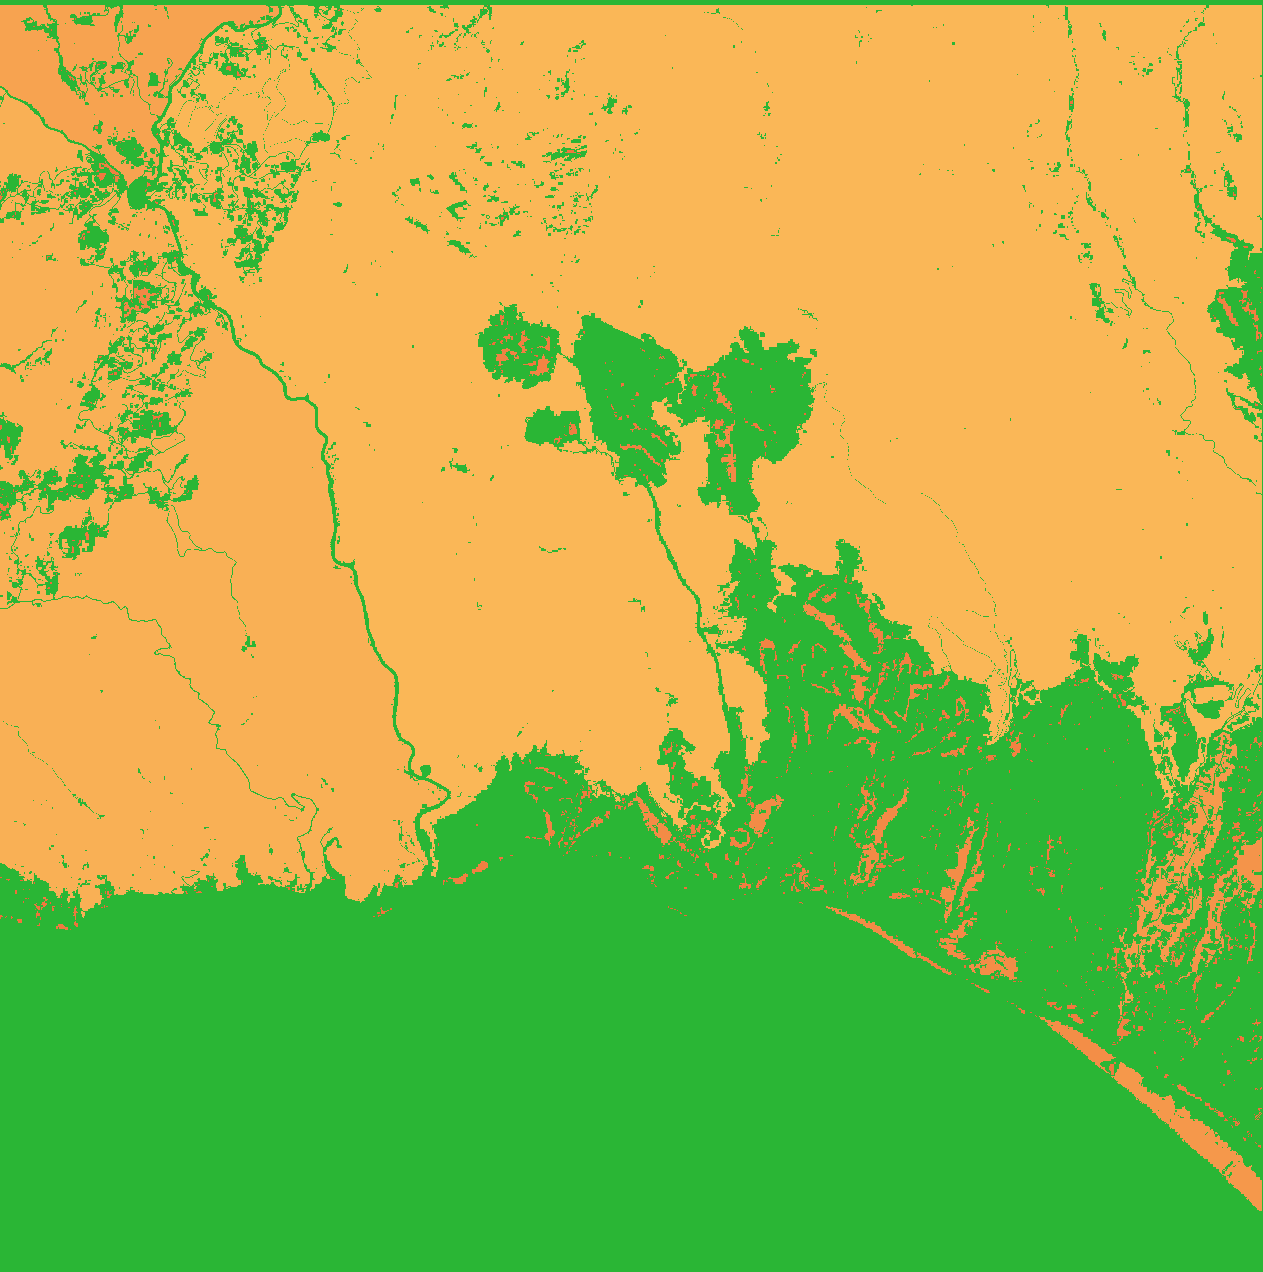
Natural and Agricultural Areas
Natural and Agricultural Areas
0.10 credits/per_km2naa
Documentation
Maps
Spectrum device heatmap
Spectrum device heatmap
spectrum_heatmap
Documentation
Maps
PollyX device heatmap
PollyX device heatmap
pollyx_heatmap
Documentation
Maps
Extreme weather events
Extreme weather events
extreme_events
Documentation
Data
Cultural and artistic heritage POIs
Cultural and artistic heritage POIs
artistic_heritage
Documentation
Data
3Bee Oasi ecological features
3Bee Oasi ecological features
threebee_oasi
Documentation
KPI
Aqueduct Water Risk
Water risk assessment using WRI Aqueduct data
5.00 credits/fixedwater_risk
Documentation
KPI
IUCN Red List
Evaluates species presence against IUCN Red List of Threatened Species
5.00 credits/fixedred_list
Documentation
Reports
Biodiversity Report
Full biodiversity report with data aggregation, charts, and AI analysis via Google Docs
5.00 credits/fixedreport_generation
Documentation
AI
AI Comment Generation
AI-powered analysis and commentary on monitoring data using Gemini
3.00 credits/fixedai_comments
Documentation
Maps
Mean Species Abundance
Mean Species Abundance
10.00 credits/per_km2msa
Documentation

Maps
MSA Climate Change component
MSA Climate Change component
8.00 credits/per_km2msa_cc
Documentation
Maps
MSA Infrastructure component
MSA Infrastructure component
8.00 credits/per_km2msa_i
Documentation
Maps
MSA Fragmentation component
MSA Fragmentation component
8.00 credits/per_km2msa_f
Documentation
Maps
MSA Land Use - Plants
MSA Land Use - Plants
8.00 credits/per_km2msa_lu_plants
Documentation
Maps
MSA Land Use - Animals
MSA Land Use - Animals
8.00 credits/per_km2msa_lu_animals
Documentation
Maps
Pollination Abundance
Pollination Abundance
10.00 credits/per_km2pa
Documentation
Maps
PA - Soil excavators nesting
PA - Soil excavators nesting
6.00 credits/per_km2pa_ns_soilexcavators
Documentation

Maps
PA - Sand excavators nesting
PA - Sand excavators nesting
6.00 credits/per_km2pa_ns_sandexcavators
Documentation
Maps
PA - Underground cavities nesting
PA - Underground cavities nesting
6.00 credits/per_km2pa_ns_underground_cavities
Documentation

Maps
PA - Wetland cavities nesting
PA - Wetland cavities nesting
6.00 credits/per_km2pa_ns_aboveground_cavities_wetland
Documentation
Maps
PA - Vegetated cavities nesting
PA - Vegetated cavities nesting
6.00 credits/per_km2pa_ns_aboveground_cavities_vegetated
Documentation

Maps
PA - Artificial nesting
PA - Artificial nesting
6.00 credits/per_km2pa_ns_artificial
Documentation

Maps
PA - Coastal area nesting
PA - Coastal area nesting
6.00 credits/per_km2pa_ns_coastal_area
Documentation
Maps
Nesting Sites suitability
Nesting Sites suitability
10.00 credits/per_km2ns
Documentation
Maps
NS - Soil excavators
NS - Soil excavators
6.00 credits/per_km2ns_ns_soilexcavators
Documentation

Maps
NS - Sand excavators
NS - Sand excavators
6.00 credits/per_km2ns_ns_sandexcavators
Documentation
Maps
NS - Underground cavities
NS - Underground cavities
6.00 credits/per_km2ns_ns_underground_cavities
Documentation

Maps
NS - Wetland cavities
NS - Wetland cavities
6.00 credits/per_km2ns_ns_aboveground_cavities_wetland
Documentation
Maps
NS - Vegetated cavities
NS - Vegetated cavities
6.00 credits/per_km2ns_ns_aboveground_cavities_vegetated
Documentation

Maps
NS - Artificial nesting
NS - Artificial nesting
6.00 credits/per_km2ns_ns_artificial
Documentation

Maps
NS - Coastal areas
NS - Coastal areas
6.00 credits/per_km2ns_ns_coastal_area
Documentation
Maps
Nectariferous Potential
Nectariferous Potential
8.00 credits/per_km2np
Documentation
Maps
Flowering Area
Flowering Area
8.00 credits/per_km2fa
Documentation
Risks
Climate Change
Change in average temperature compared to the 1950-1970 baseline and increase in extreme event frequency.
0.50 credits/fixedclimate_change
Documentation
Risks
Wind
Wind speed and direction analysis over time
0.30 credits/fixedwind
Documentation
Risks
Heat Wave
Extended periods of extreme temperatures causing infrastructure strain and productivity loss.
0.30 credits/fixedheat_wave
Documentation
Risks
Cold Wave
Extended periods of extremely low temperatures impacting infrastructure and operations.
0.30 credits/fixedcold_wave
Documentation
Risks
Total Precipitation
Total precipitation (rain + snow) analysis over time
0.50 credits/fixedprecipitation
Documentation
Risks
Precipitation Pattern Change
Long-term change in precipitation patterns impacting land productivity.
2.30 credits/fixedprecipitation_pattern_change
Documentation
Risks
Wildfire
Risk of wildfires threatening structures, grounds, and air quality.
2.40 credits/fixedfire
Documentation
Risks
Heat Stress
Health and productivity risk from prolonged excessive heat conditions.
0.60 credits/fixedheat_stress
Documentation
Risks
Extreme Heat
Record-breaking temperatures causing infrastructure failures and health risks.
3.10 credits/fixedextreme_heat
Documentation
Risks
Extreme Storm
Violent storms with hurricane-force winds and risk of structural failure.
0.60 credits/fixedextreme_storm
Documentation
Risks
Drought
Prolonged water scarcity with operational restrictions and increased costs.
0.50 credits/fixeddrought
Documentation
Risks
Desertification
Progressive land degradation with loss of productivity and land value.
0.50 credits/fixeddesertification
Documentation
Risks
Flood
Risk of flooding with structural damage and operational disruption.
0.50 credits/fixedflood
Documentation
Risks
Aridity
Long-term drying trend impacting land productivity and increasing water costs.
0.60 credits/fixedrisk_aridity
Documentation
Risks
Water Stress
Imbalance between water demand and supply leading to restrictions and rationing.
1.00 credits/fixedwater_stress
Documentation
Risks
Air Quality
Health risk from air pollution and associated mortality rates.
0.10 credits/fixedair_quality
Documentation
Risks
Landslide
Risk of slope instability with potential damage to foundations and structures.
2.20 credits/fixedlandslide
Documentation
Risks
Biodiversity Loss
Decline of local ecosystem health impacting ecosystem services like pollination.
2.40 credits/fixedbiodiversity_loss
Documentation
Risks
Earthquake
Seismic risk with potential structural damage ranging from minor to catastrophic.
0.10 credits/fixedearthquake
Documentation
Risks
Volcanic Eruption
Risk from ash, lahars, and pyroclastic flows with potential destruction.
0.10 credits/fixedvolcanic_eruption
Documentation
Risks
Rising Ocean Temperature
Sea surface temperature anomalies impacting coastal ecosystems and ocean-dependent operations.
0.50 credits/fixedrising_ocean_temperature
Documentation
Risks
Sea Level Rise
Recurring high-tide flooding, salinization, and progressive coastal land loss.
0.10 credits/fixedsea_level_rise
Documentation
Risks
Coastal Flooding
Risk of storm surge flooding with structural damage and corrosion.
0.10 credits/fixedcoastal_flooding
Documentation
Risks
Coastal Erosion
Shoreline retreat impacting foundations, infrastructure, and access routes.
0.10 credits/fixedcoastal_erosion
Documentation
Risks
Ocean Acidification
Changes in ocean pH impacting marine ecosystems and ocean-dependent operations.
0.30 credits/fixedocean_acidification
Documentation
KPI
Historical Temperature
Historical analysis of mean, max and min temperatures over time
1.00 credits/fixedtemperature_historical
Documentation
KPI
Future Temperature
Climate temperature projections based on SSP scenarios
1.00 credits/fixedtemperature_future
Documentation
KPI
Rainfall
Rainfall precipitation analysis over time
1.00 credits/fixedrain
Documentation
KPI
Weather Distribution
Distribution of weather codes and atmospheric conditions
1.00 credits/fixedweather_distribution
Documentation
KPI
Cloud Cover
Cloud cover mean analysis over time
1.00 credits/fixedhistorical_cloud_cover
Documentation
KPI
Evapotranspiration
FAO reference evapotranspiration analysis over time
1.00 credits/fixedhistorical_evapotranspiration
Documentation
KPI
Snow
Snowfall precipitation analysis over time
1.00 credits/fixedhistorical_snowfall
Documentation
KPI
Apparent Temperature
Apparent (feels-like) temperature mean, max and min analysis over time
1.00 credits/fixedhistorical_apparent_temperature
Documentation
KPI
Daylight Duration
Daylight duration analysis over time
1.00 credits/fixedhistorical_daylight_duration
Documentation
KPI
Sunshine Duration
Actual sunshine hours analysis over time
1.00 credits/fixedhistorical_sunshine_duration
Documentation
KPI
Wind Gusts
Wind gusts mean, max and min analysis over time
1.00 credits/fixedhistorical_wind_gusts
Documentation
KPI
Shortwave Radiation
Shortwave solar radiation analysis over time
1.00 credits/fixedhistorical_shortwave_radiation
Documentation
KPI
Dew Point
Dew point mean, max and min analysis over time
1.00 credits/fixedhistorical_dew_point
Documentation
KPI
Relative Humidity
Relative humidity mean, max and min analysis over time
1.00 credits/fixedhistorical_relative_humidity
Documentation
KPI
Atmospheric Pressure
Atmospheric pressure (MSL) mean, max and min analysis over time
1.00 credits/fixedhistorical_pressure
Documentation
KPI
Wet Bulb Temperature
Wet bulb temperature mean, max and min analysis over time
1.00 credits/fixedhistorical_wet_bulb_temperature
Documentation
KPI
Soil Moisture
Soil moisture analysis at various depths over time
1.00 credits/fixedhistorical_soil_moisture
Documentation
KPI
Soil Temperature
Soil temperature analysis at various depths over time
1.00 credits/fixedhistorical_soil_temperature
Documentation
KPI
River Discharge
River discharge analysis over time
1.00 credits/fixedriver_discharge
Documentation
KPI
PM10
PM10 particulate matter analysis over time
1.00 credits/fixedpm10
Documentation
KPI
PM2.5
PM2.5 fine particulate matter analysis over time
1.00 credits/fixedpm2_5
Documentation
KPI
Carbon Dioxide
Carbon dioxide (CO2) concentration analysis over time
1.00 credits/fixedcarbon_dioxide
Documentation
KPI
Sulphur Dioxide
Sulphur dioxide (SO2) concentration analysis over time
1.00 credits/fixedsulphur_dioxide
Documentation
KPI
Aerosol Optical Depth
Aerosol optical depth (AOD) analysis over time
1.00 credits/fixedaerosol_optical_depth
Documentation
KPI
Dust
Dust concentration analysis over time
1.00 credits/fixeddust
Documentation
KPI
UV Index
Ultraviolet radiation index analysis over time
1.00 credits/fixeduv_index
Documentation
KPI
UV Index Clear Sky
UV index under clear sky conditions analysis over time
1.00 credits/fixeduv_index_clear_sky
Documentation
KPI
European Air Quality Index
European Air Quality Index (EAQI) analysis over time
1.00 credits/fixedeuropean_aqi
Documentation
KPI
US Air Quality Index
US Air Quality Index (US AQI) analysis over time
1.00 credits/fixedus_aqi
Documentation
KPI
Landslides
Landslide and erosion risk assessment based on past events
1.00 credits/fixedlandslides
Documentation
KPI
Distances
Distances from geographical features and urban centres
1.00 credits/fixeddistances
Documentation
KPI
Protected Areas Index
KPI based on proximity and coverage of protected areas
protected_areas_index
Documentation
KPI
Historical Precipitations
Historical analysis of total, mean and max precipitations over time
1.00 credits/fixedprecipitation_historical
Documentation
KPI
Future Precipitations
Climate precipitations projections based on SSP scenarios
1.00 credits/fixedprecipitation_future
Documentation
KPI
Annual Wind
Wind speed and direction analysis for the year
1.00 credits/fixedwind_year
Documentation
KPI
Historical Temperature
Historical analysis of mean, max and min temperatures over time
1.00 credits/fixedhistorical_temperature
Documentation
KPI
Historical Climate — Total Precipitation
Historical analysis of total precipitations over time
1.00 credits/fixedhistorical_precipitation
Documentation
KPI
Historical Rainfall
Historical rainfall precipitation analysis over time
1.00 credits/fixedhistorical_rain
Documentation
KPI
Historical Wind Speed
Historical wind speed mean, max and min analysis over time
1.00 credits/fixedhistorical_wind_speed
Documentation
KPI
Historical Soil Moisture (0-7 cm)
Historical soil moisture analysis at 0-7 cm depth
1.00 credits/fixedhistorical_soil_moisture_0_to_7cm
Documentation
KPI
Historical Soil Moisture (7-28 cm)
Historical soil moisture analysis at 7-28 cm depth
1.00 credits/fixedhistorical_soil_moisture_7_to_28cm
Documentation
KPI
Historical Soil Moisture (28-100 cm)
Historical soil moisture analysis at 28-100 cm depth
1.00 credits/fixedhistorical_soil_moisture_28_to_100cm
Documentation
KPI
Historical Soil Moisture (0-100 cm)
Historical soil moisture analysis at 0-100 cm depth
1.00 credits/fixedhistorical_soil_moisture_0_to_100cm
Documentation
KPI
Historical Soil Temperature (0-7 cm)
Historical soil temperature analysis at 0-7 cm depth
1.00 credits/fixedhistorical_soil_temperature_0_to_7cm
Documentation
KPI
Historical Soil Temperature (7-28 cm)
Historical soil temperature analysis at 7-28 cm depth
1.00 credits/fixedhistorical_soil_temperature_7_to_28cm
Documentation
KPI
Historical Soil Temperature (28-100 cm)
Historical soil temperature analysis at 28-100 cm depth
1.00 credits/fixedhistorical_soil_temperature_28_to_100cm
Documentation
KPI
Historical Soil Temperature (0-100 cm)
Historical soil temperature analysis at 0-100 cm depth
1.00 credits/fixedhistorical_soil_temperature_0_to_100cm
Documentation
KPI
Future Temperature
Climate projections of mean, max and min temperature
1.00 credits/fixedfuture_temperature
Documentation
KPI
Future Climate — Total Precipitation
Climate projections of total precipitations
1.00 credits/fixedfuture_precipitation
Documentation
KPI
Future Rainfall
Climate projections of rainfall precipitation
1.00 credits/fixedfuture_rain
Documentation
KPI
Future Snowfall
Climate projections of snowfall precipitation
1.00 credits/fixedfuture_snowfall
Documentation
KPI
Future Wind Speed
Climate projections of mean and max wind speed
1.00 credits/fixedfuture_wind_speed
Documentation
KPI
Future Shortwave Radiation
Climate projections of shortwave solar radiation
1.00 credits/fixedfuture_shortwave_radiation
Documentation
KPI
Future Evapotranspiration
Climate projections of FAO reference evapotranspiration
1.00 credits/fixedfuture_evapotranspiration
Documentation
KPI
Future Cloud Cover
Climate projections of mean cloud cover
1.00 credits/fixedfuture_cloud_cover
Documentation
KPI
Future Dew Point
Climate projections of mean, max and min dew point
1.00 credits/fixedfuture_dew_point
Documentation
KPI
Future Relative Humidity
Climate projections of mean, max and min relative humidity
1.00 credits/fixedfuture_relative_humidity
Documentation
KPI
Future Atmospheric Pressure
Climate projections of mean atmospheric pressure
1.00 credits/fixedfuture_pressure
Documentation
KPI
Future Soil Moisture
Climate projections of soil moisture at 0-10 cm depth
1.00 credits/fixedfuture_soil_moisture
Documentation
Maps
Plastic Input in Rivers
Mismanaged plastic waste flowing from rivers into oceans (kg/year)
1.00 credits/per_km2plastic_input_rivers
Documentation
Maps
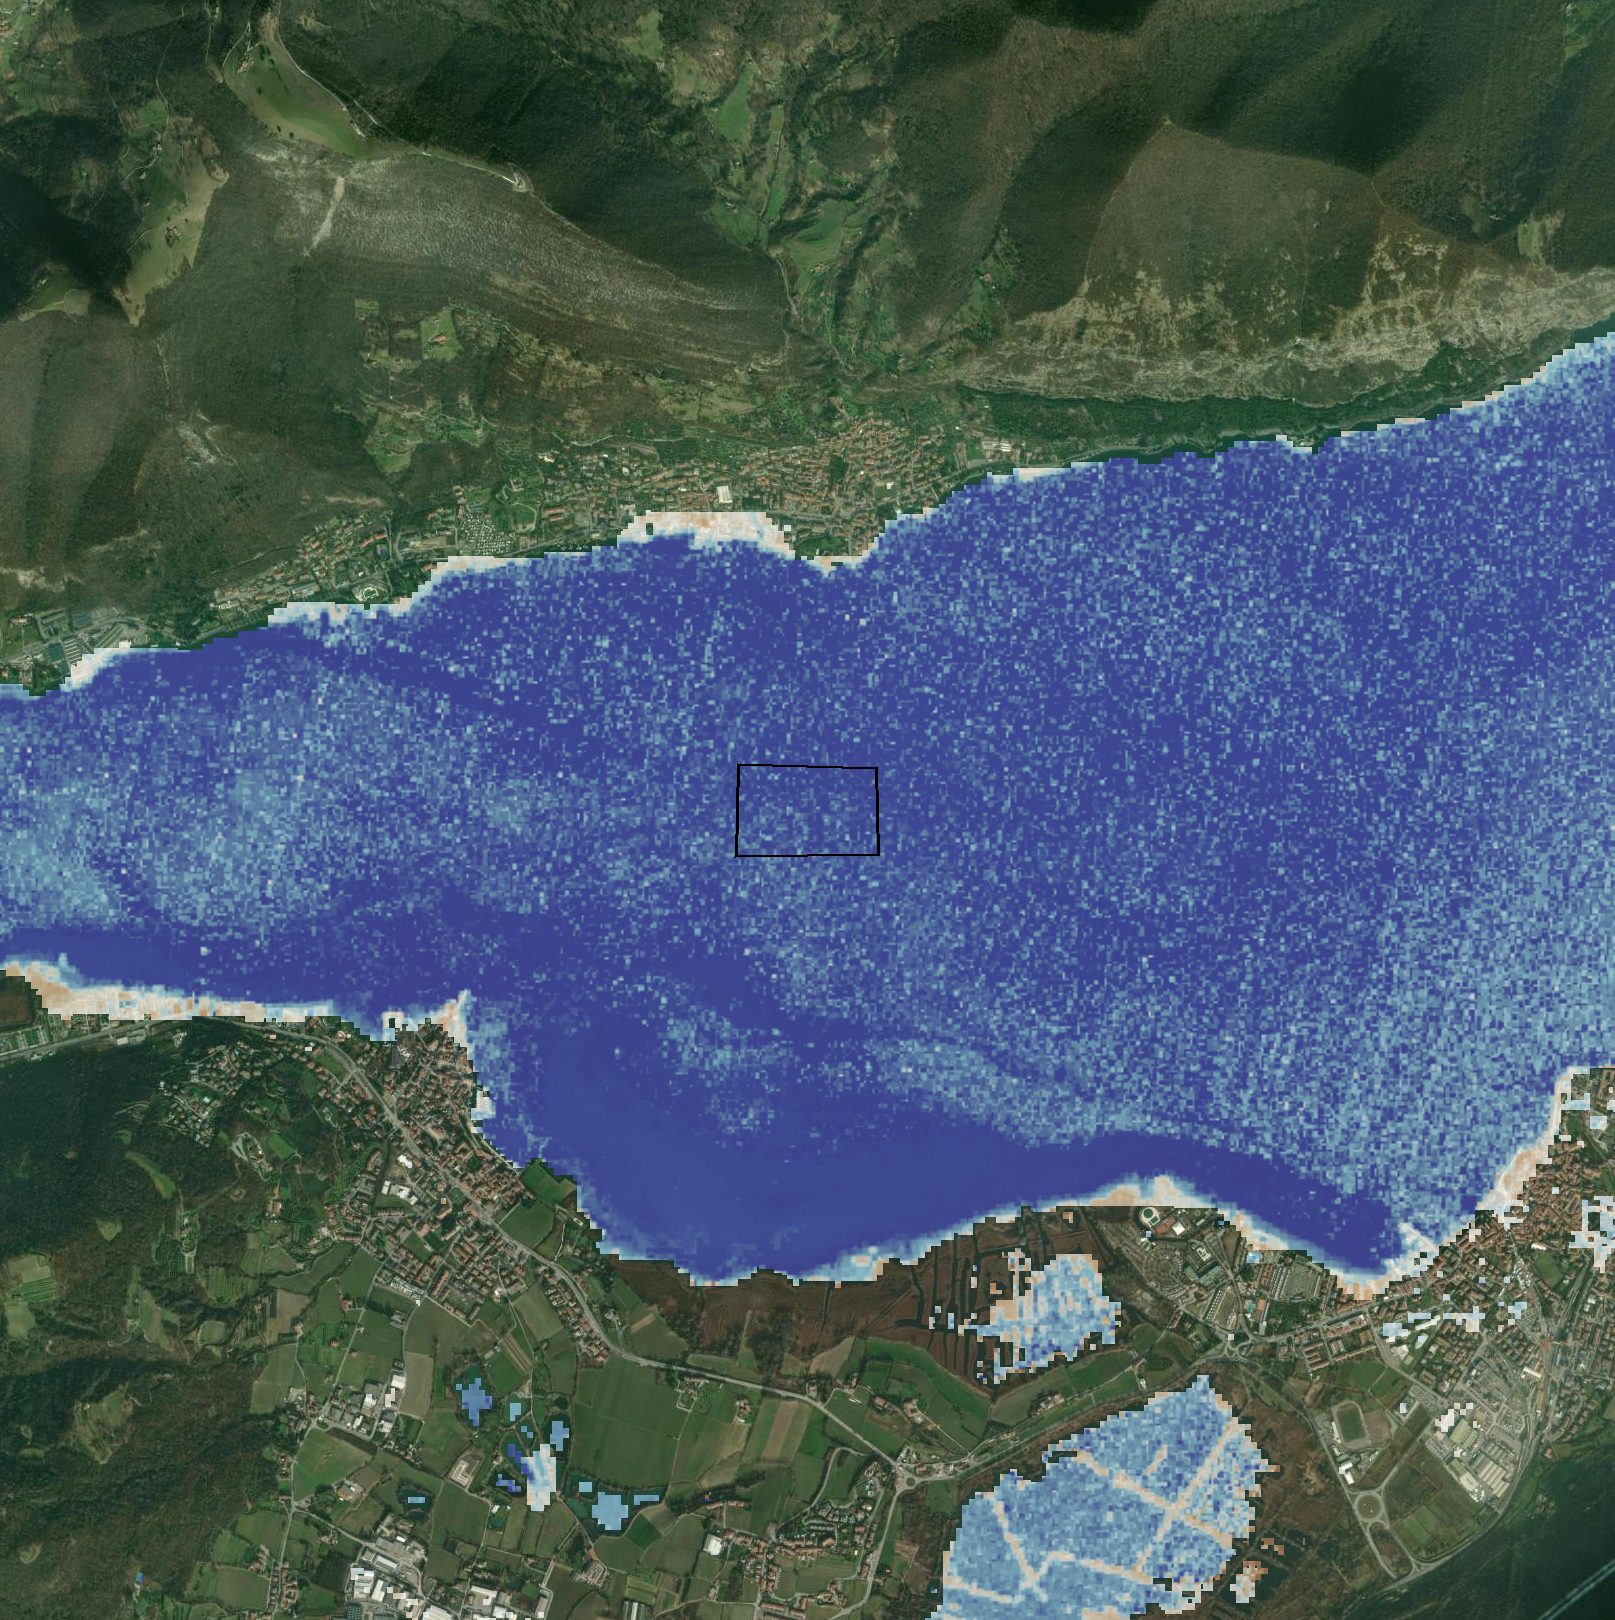
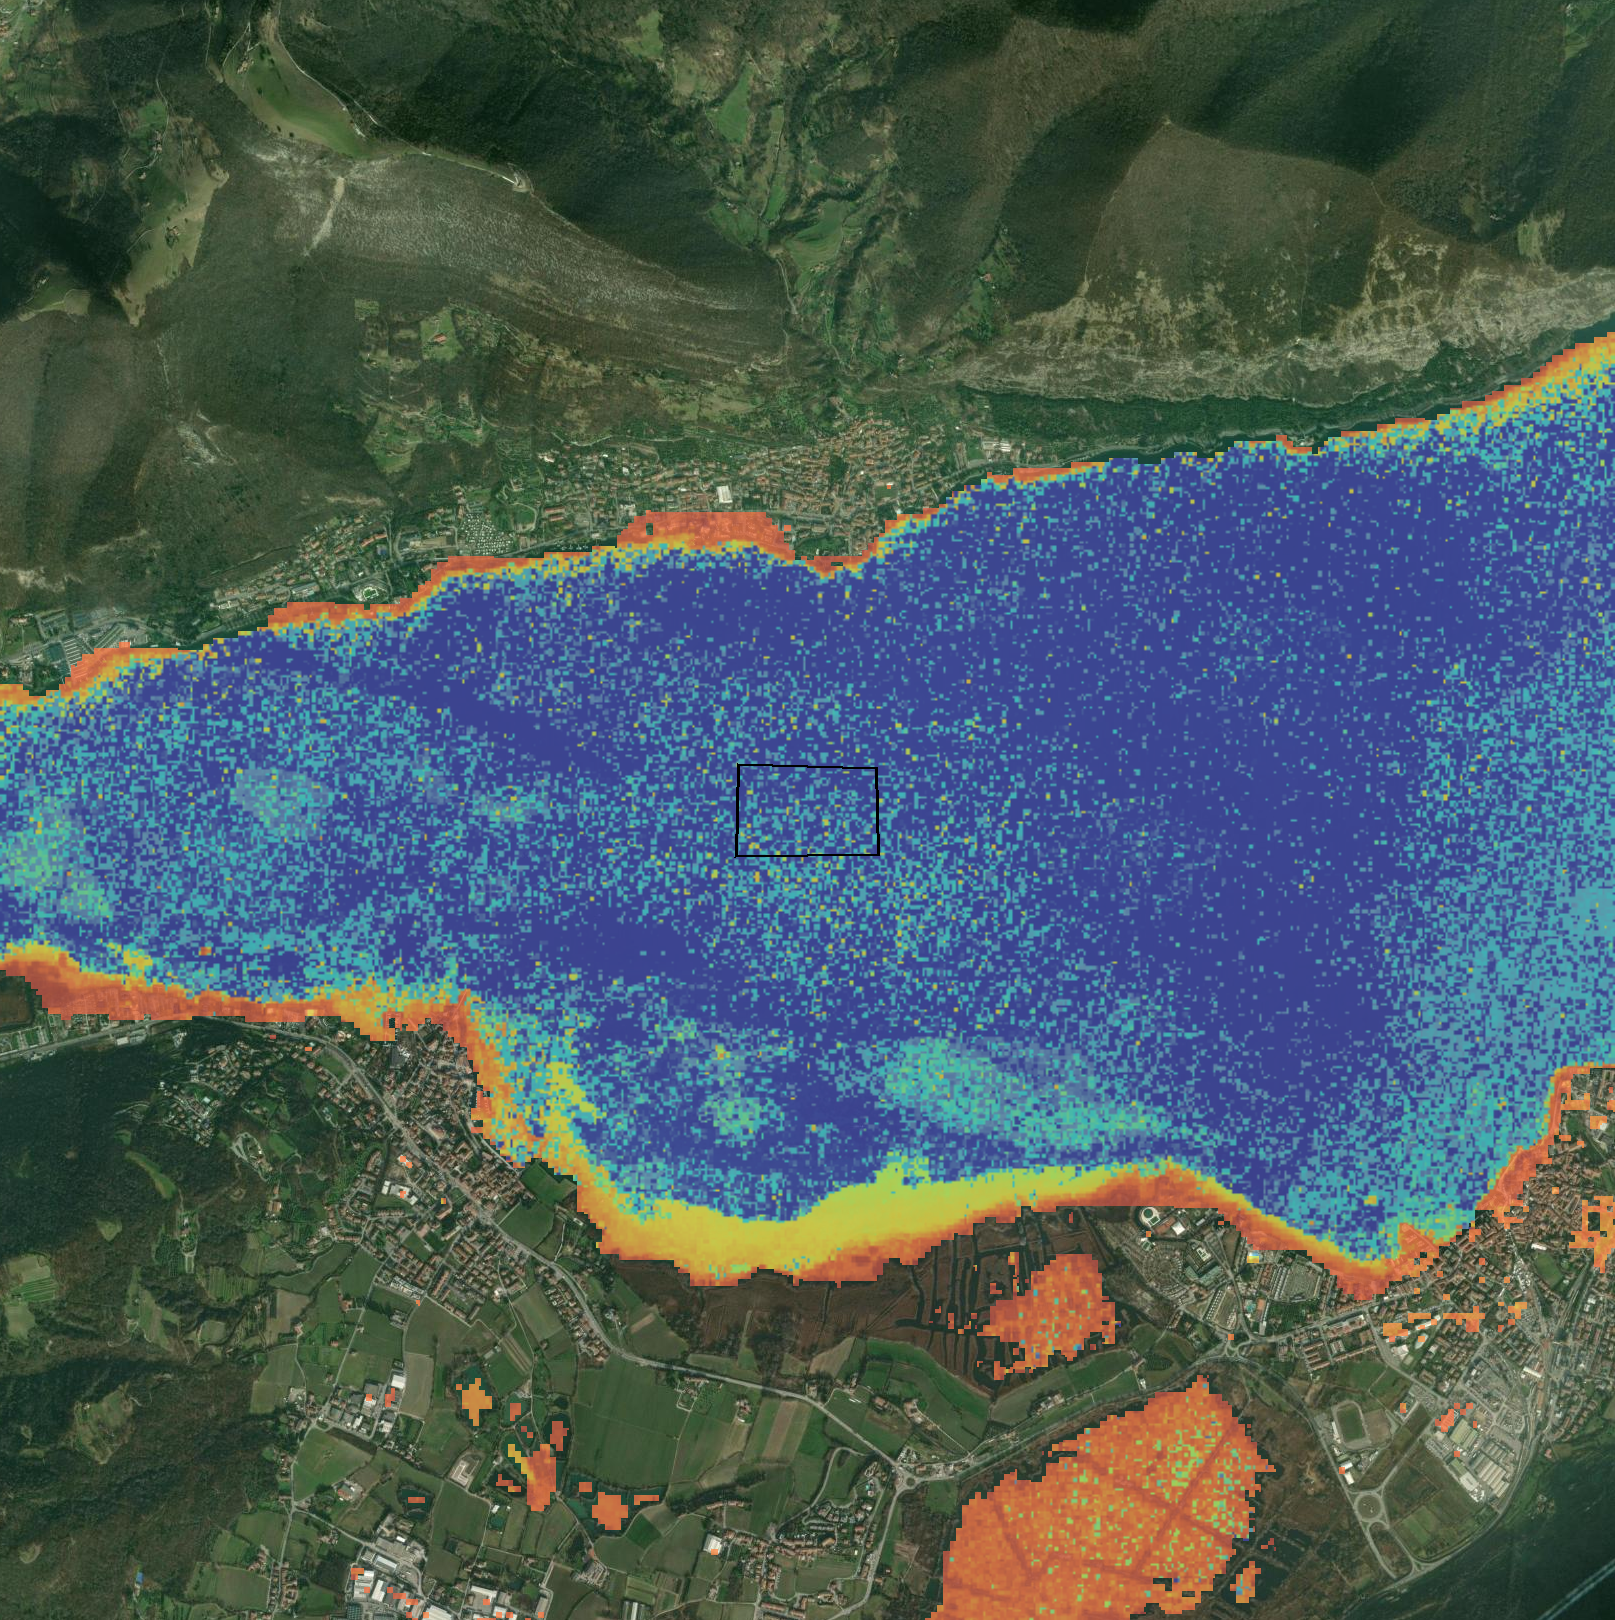
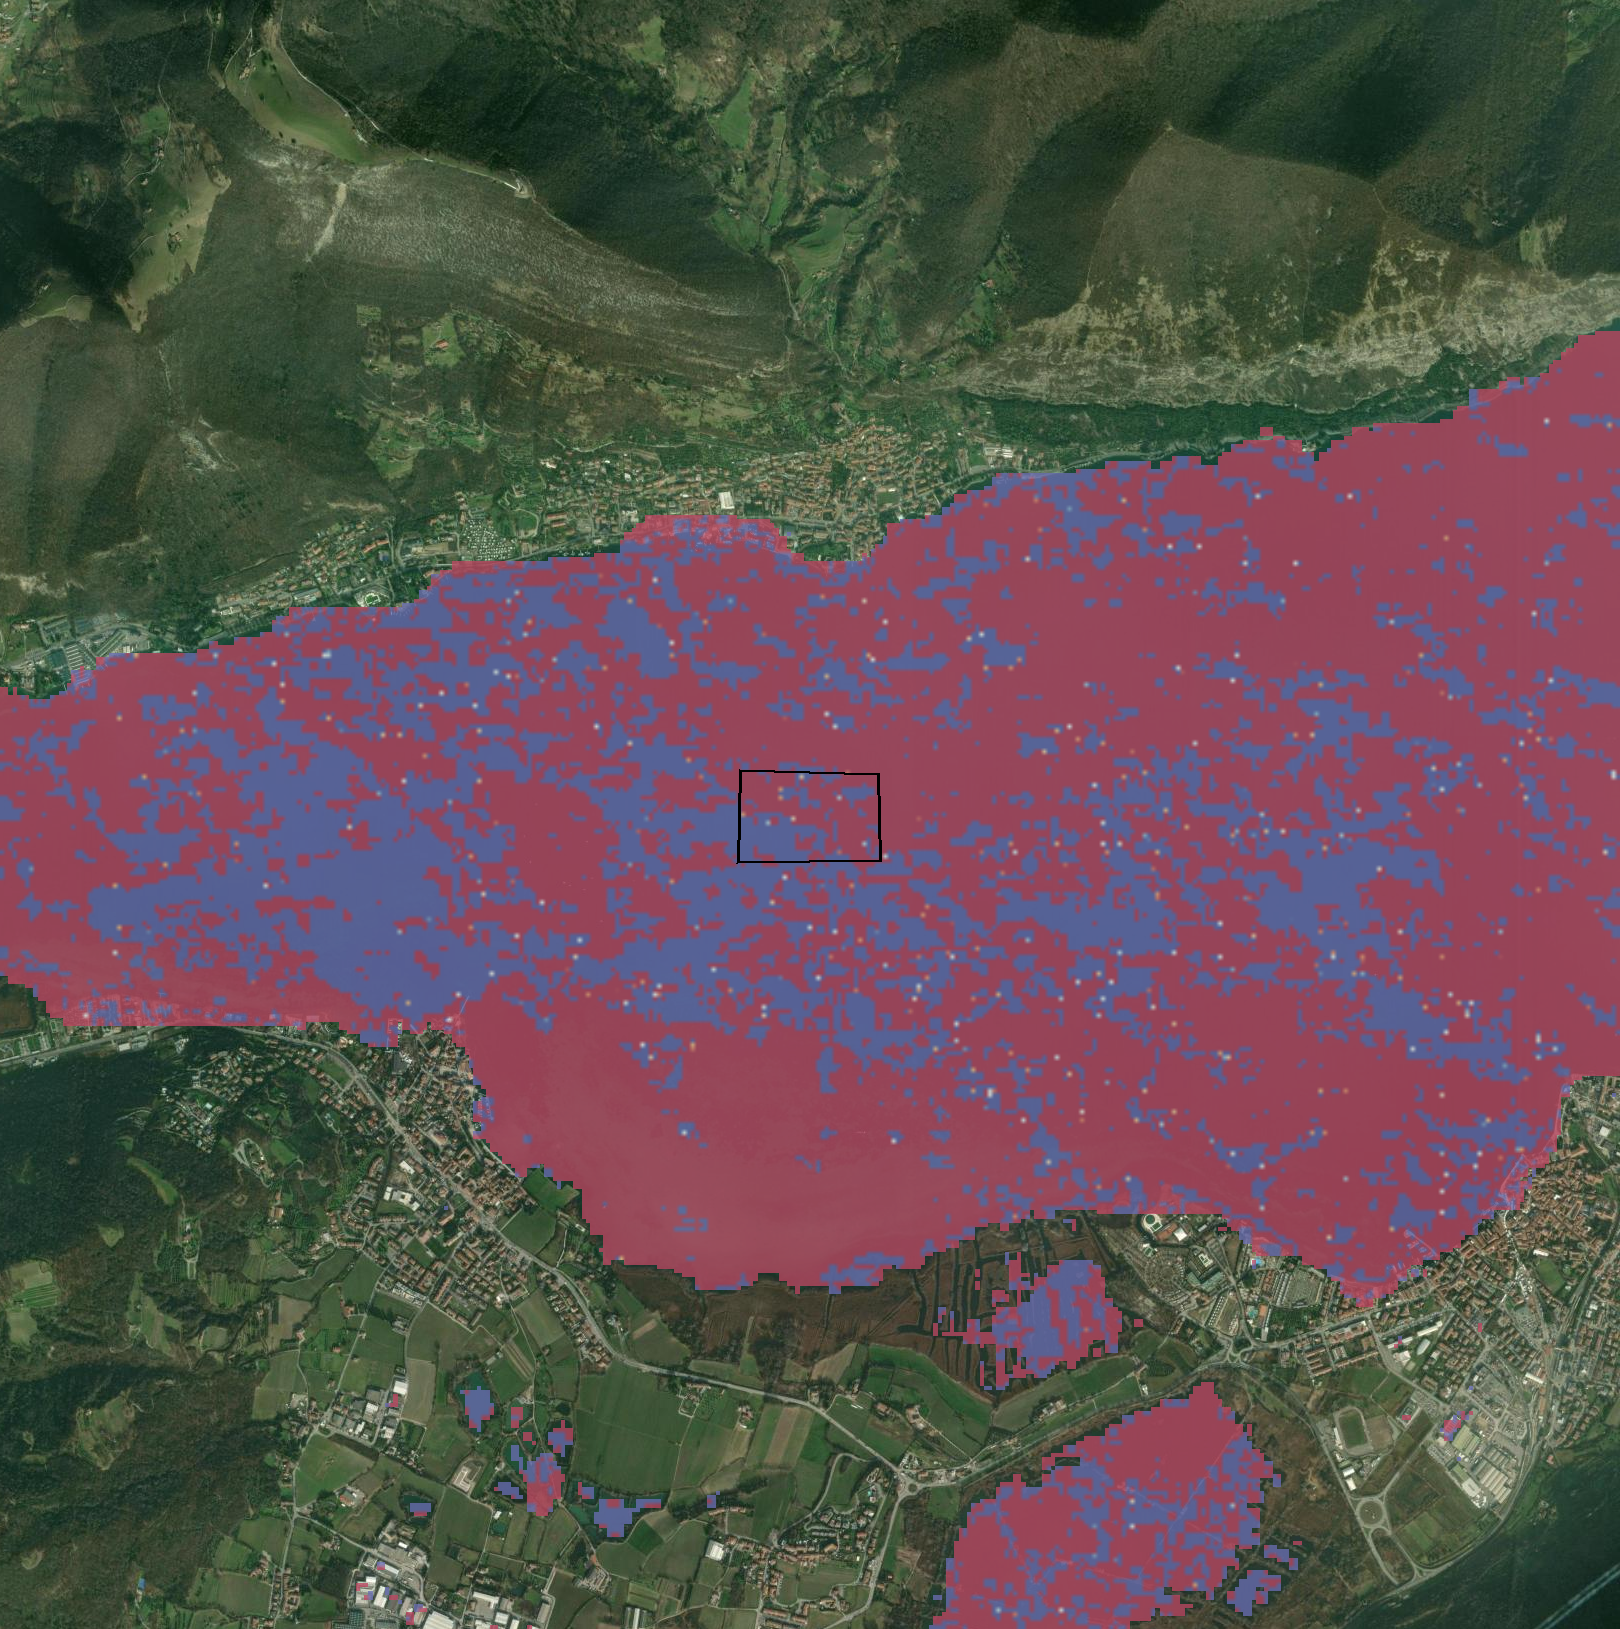
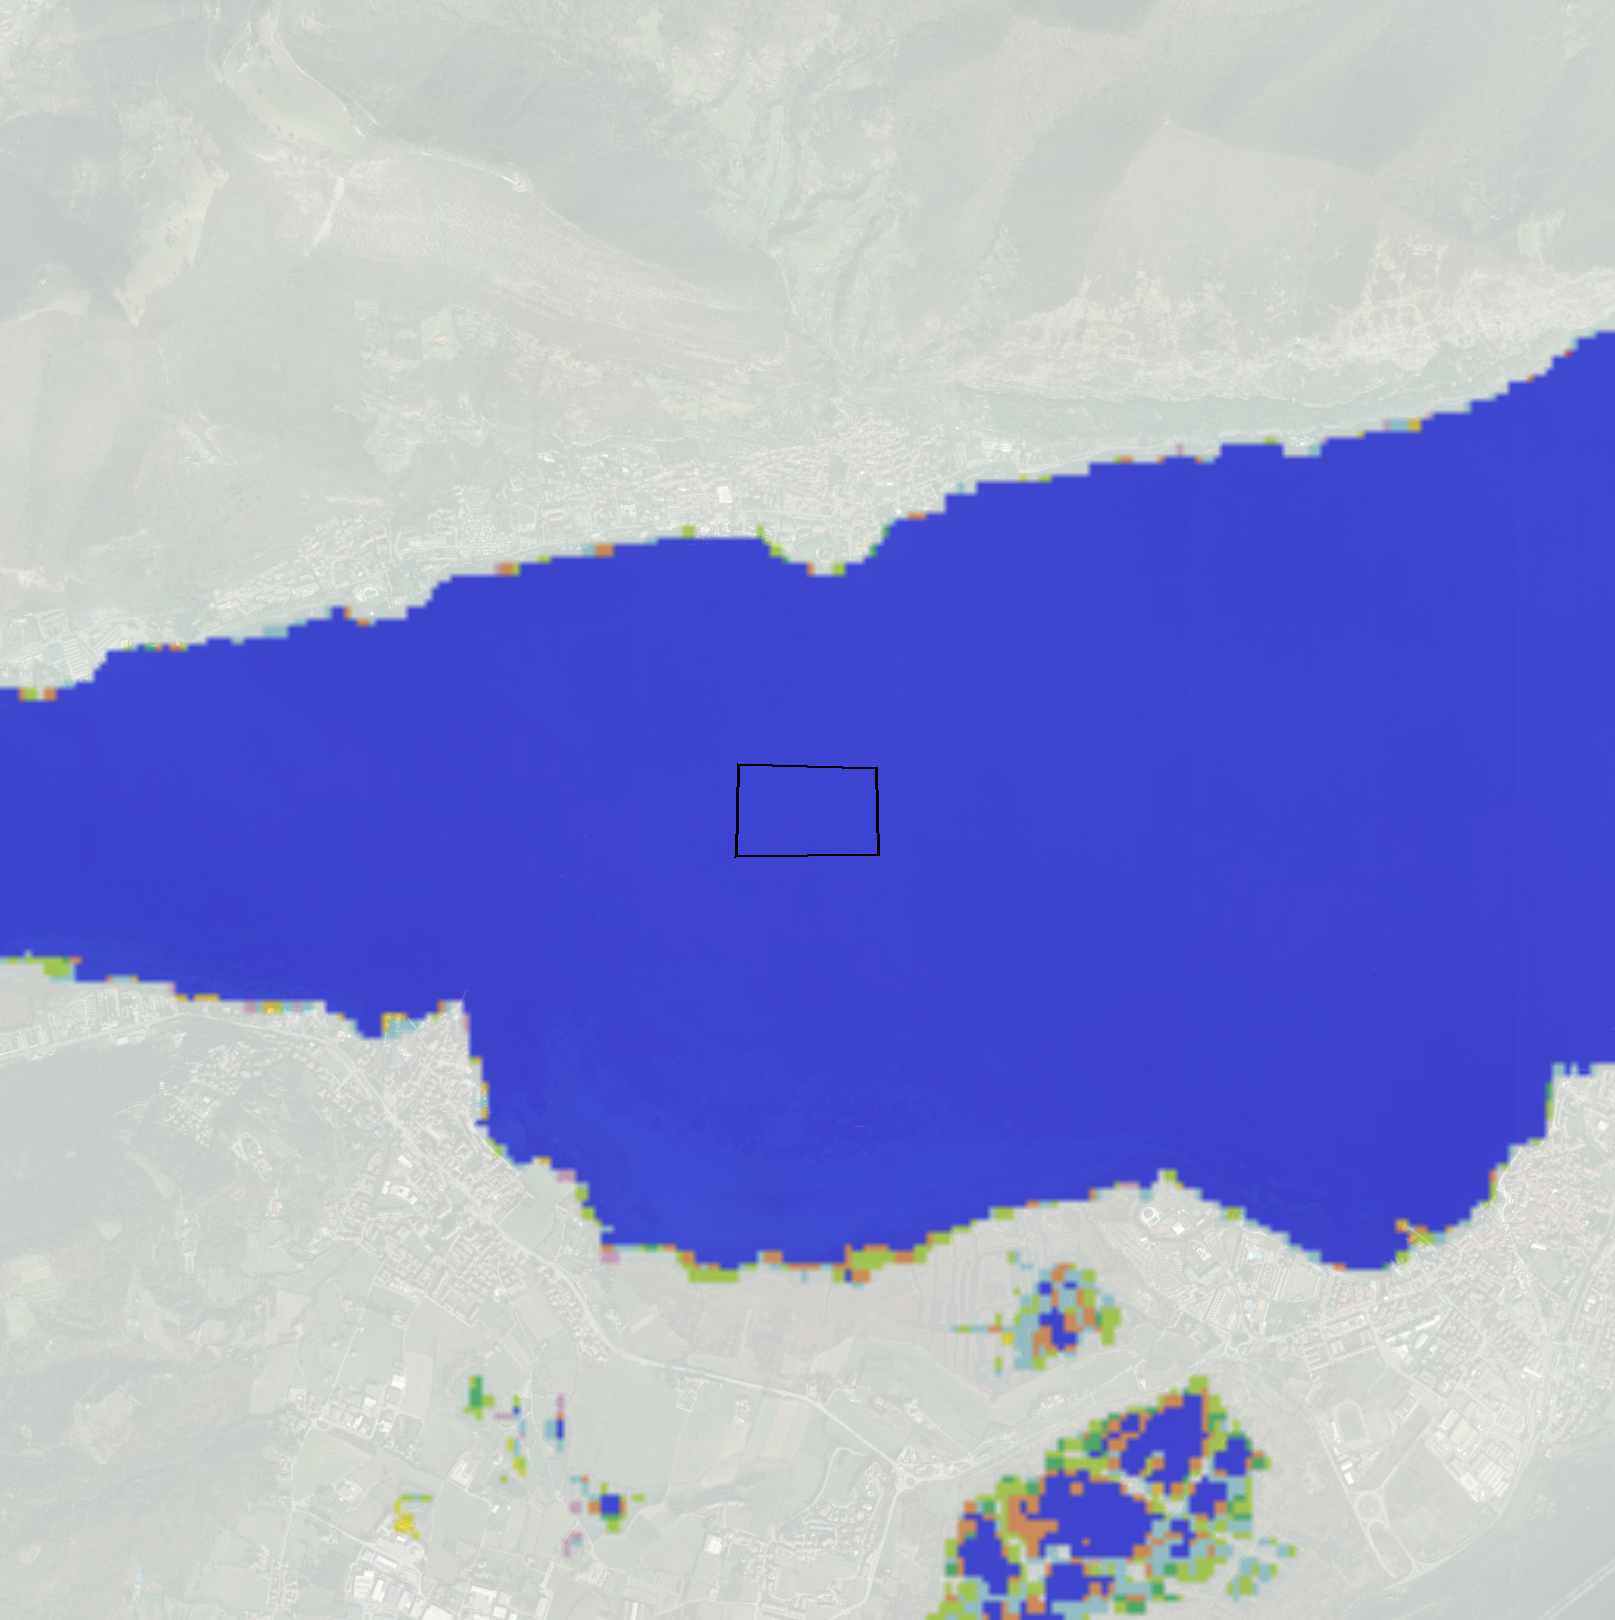
Turbidity (NDTI)
Normalized Difference Turbidity Index - measures water turbidity at 10m resolution
4.00 credits/per_km2turbidity
Documentation
Maps
Turbidity (NDTI) Annual Range
Annual mean of water turbidity over the selected period
5.00 credits/per_km2turbidity_range
Documentation
Maps
Turbidity (NDTI) Range Delta
Water turbidity change between two annual periods
6.00 credits/per_km2turbidity_range_delta
Documentation
Maps
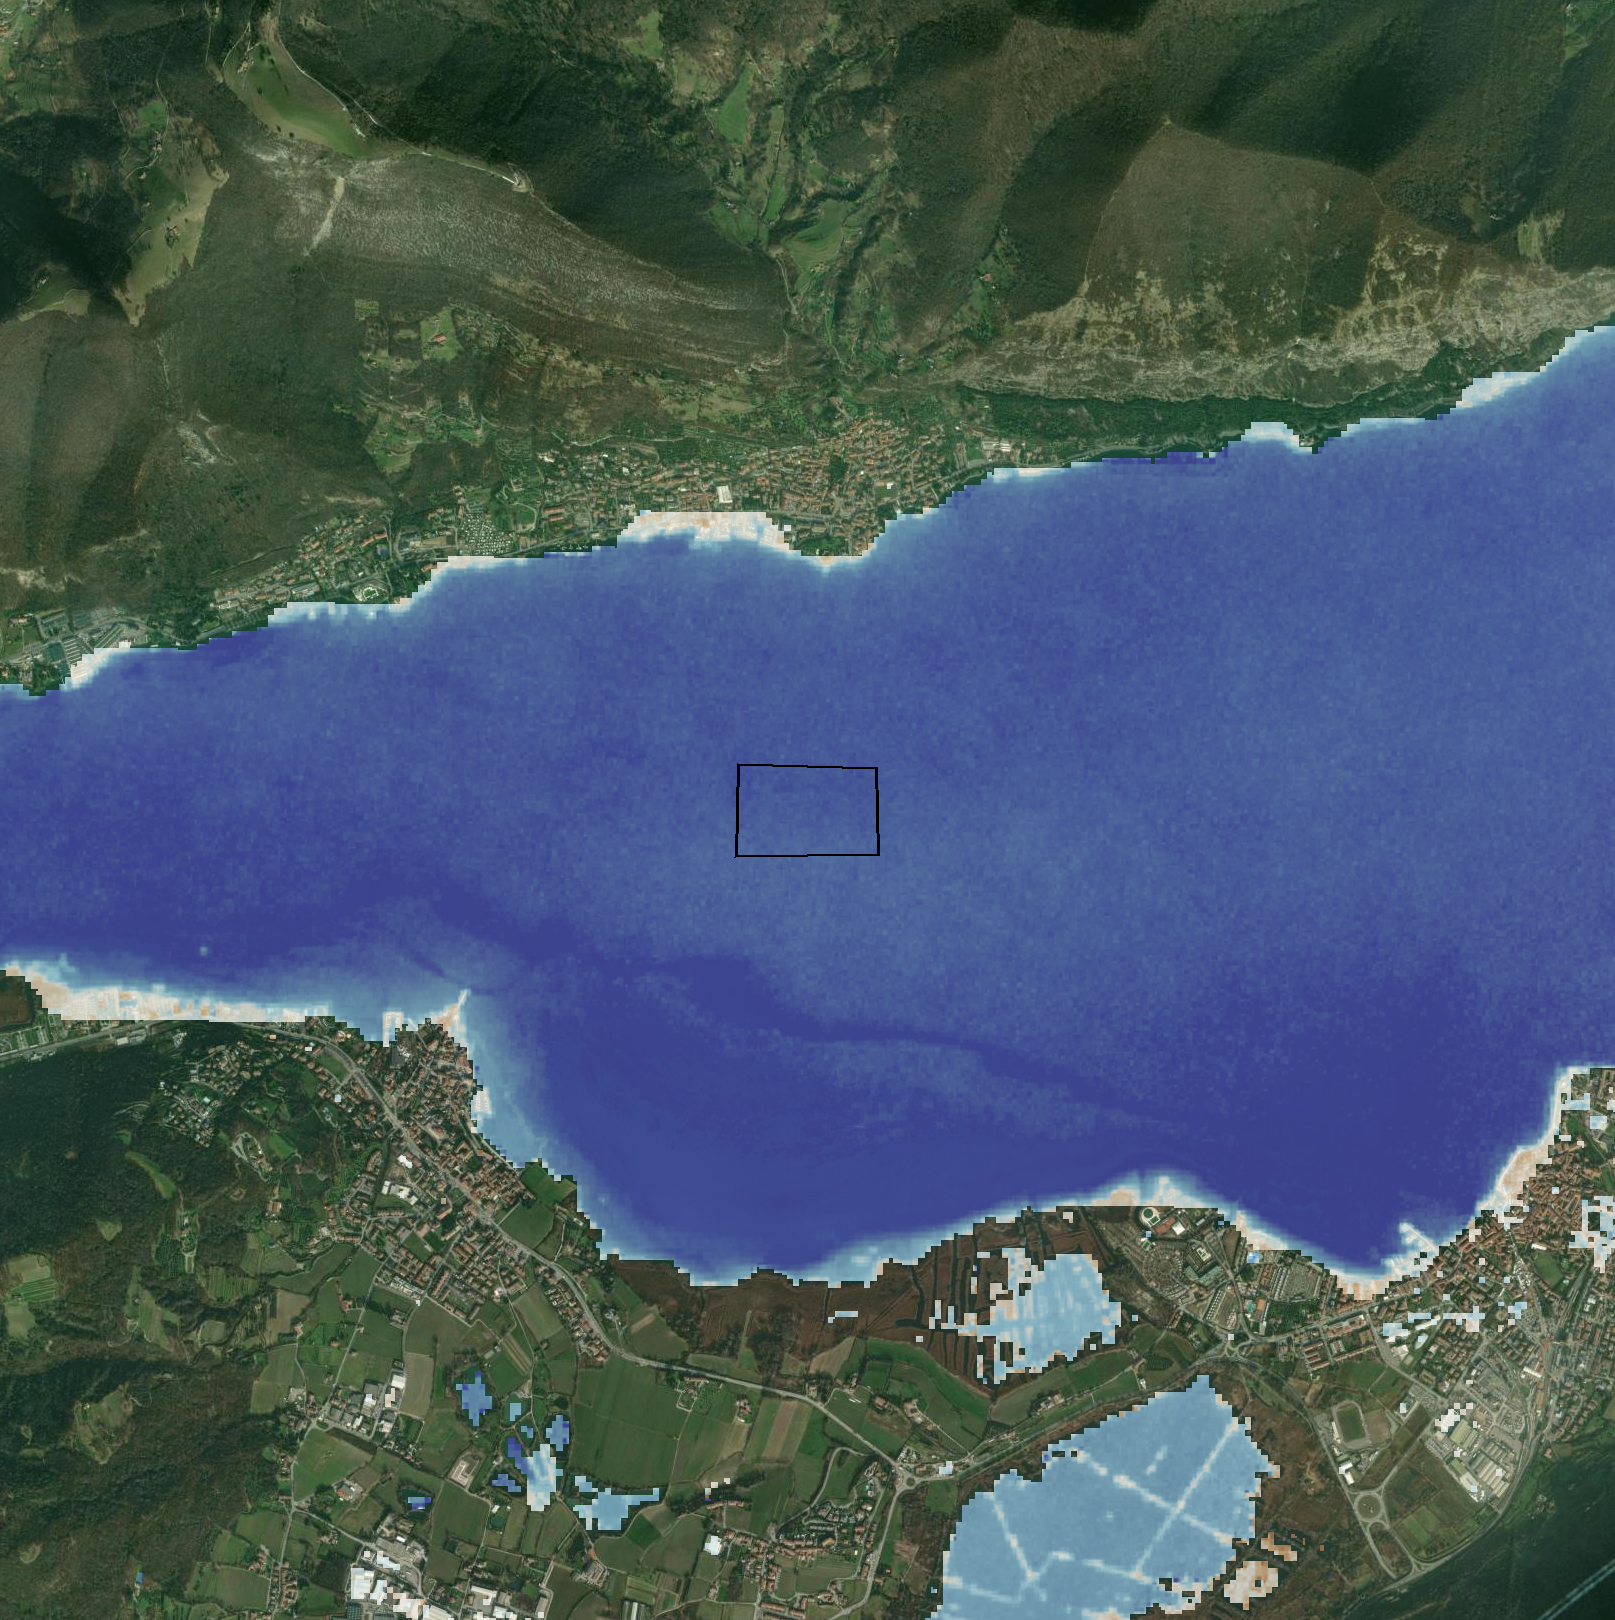
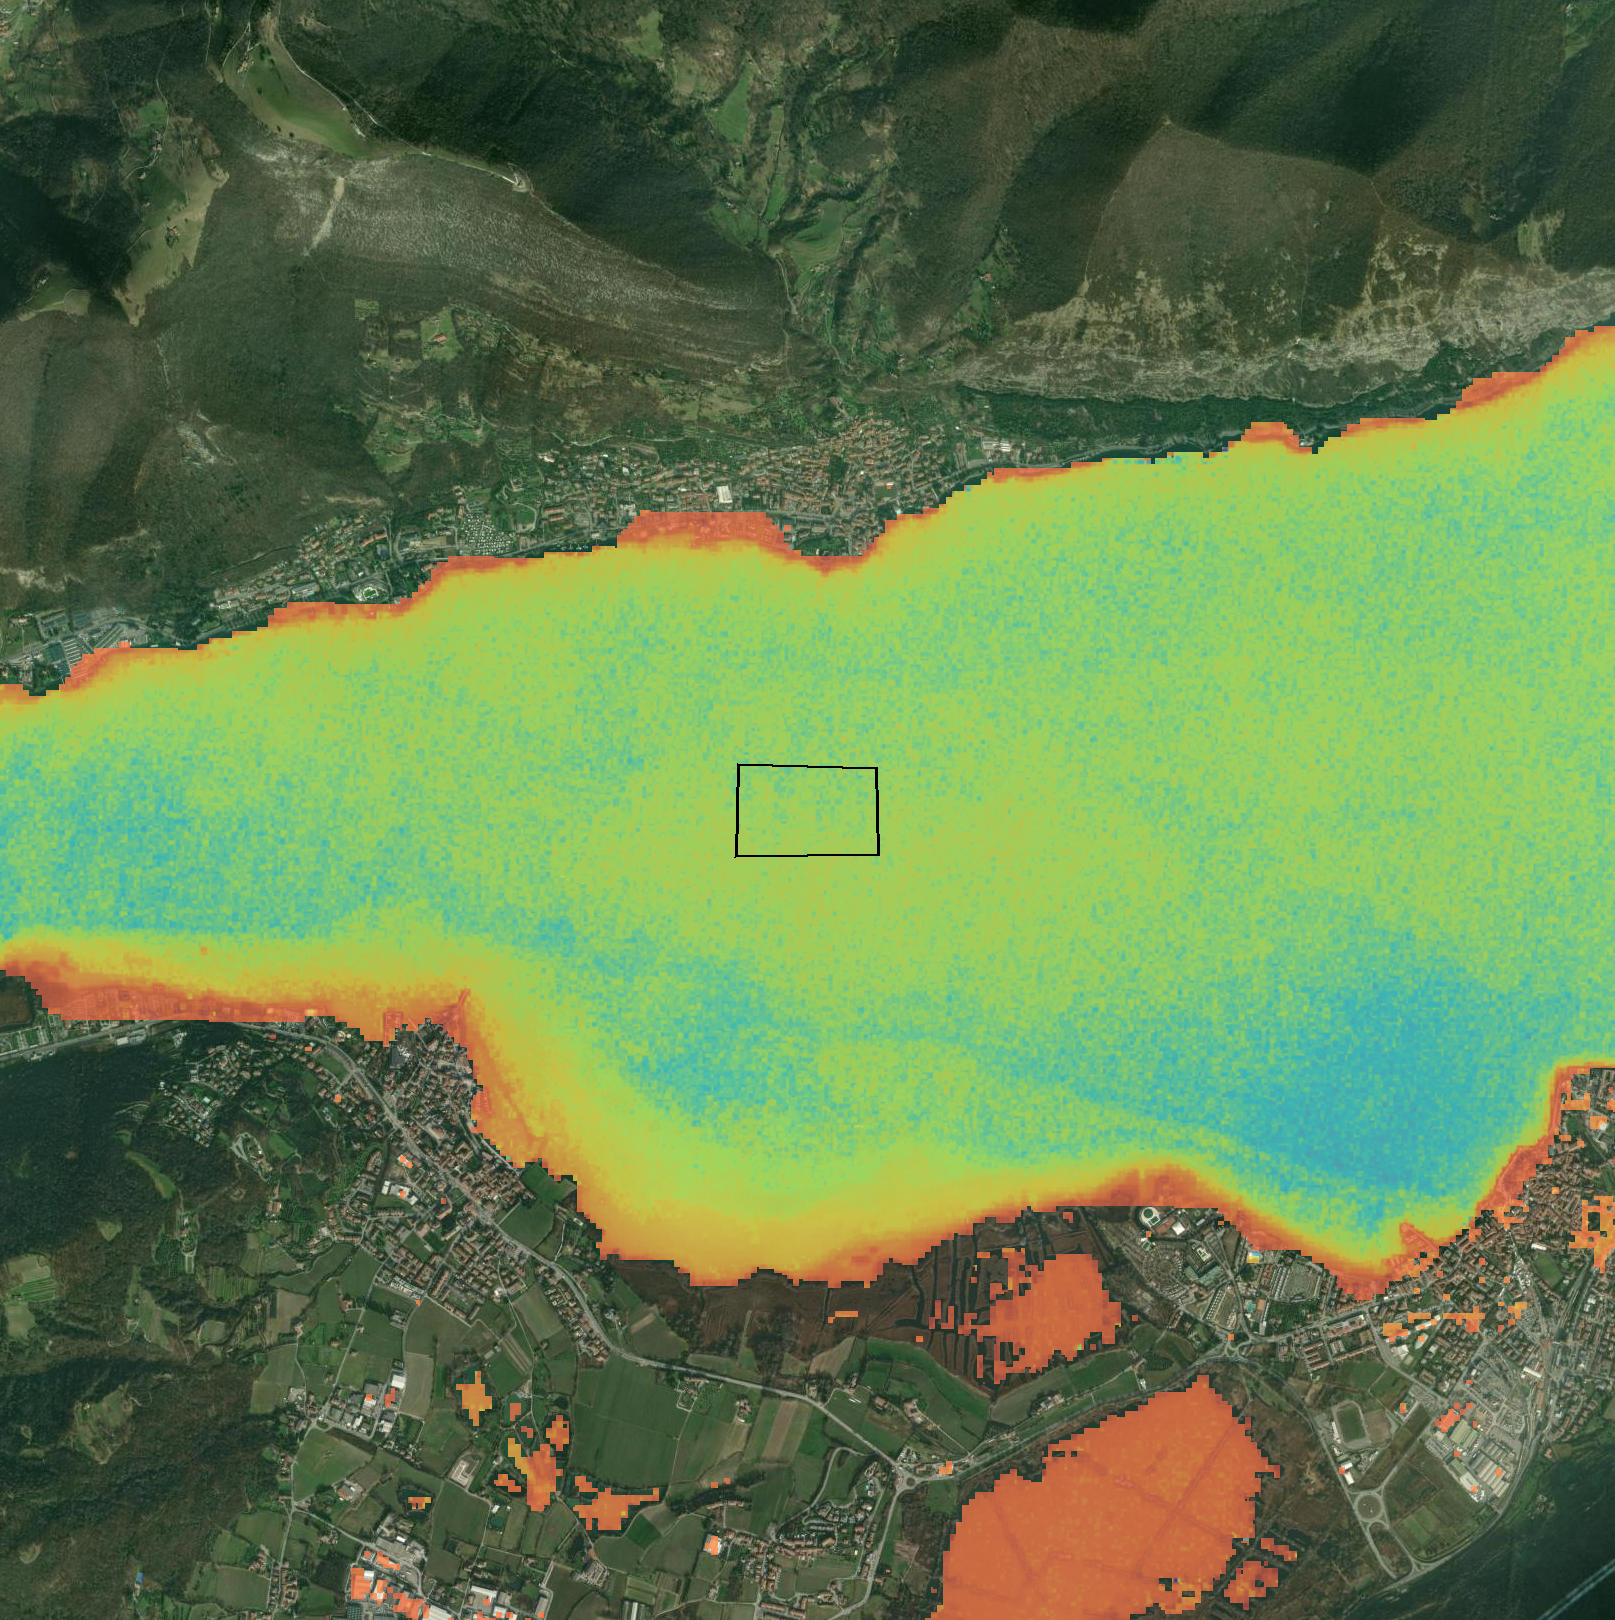
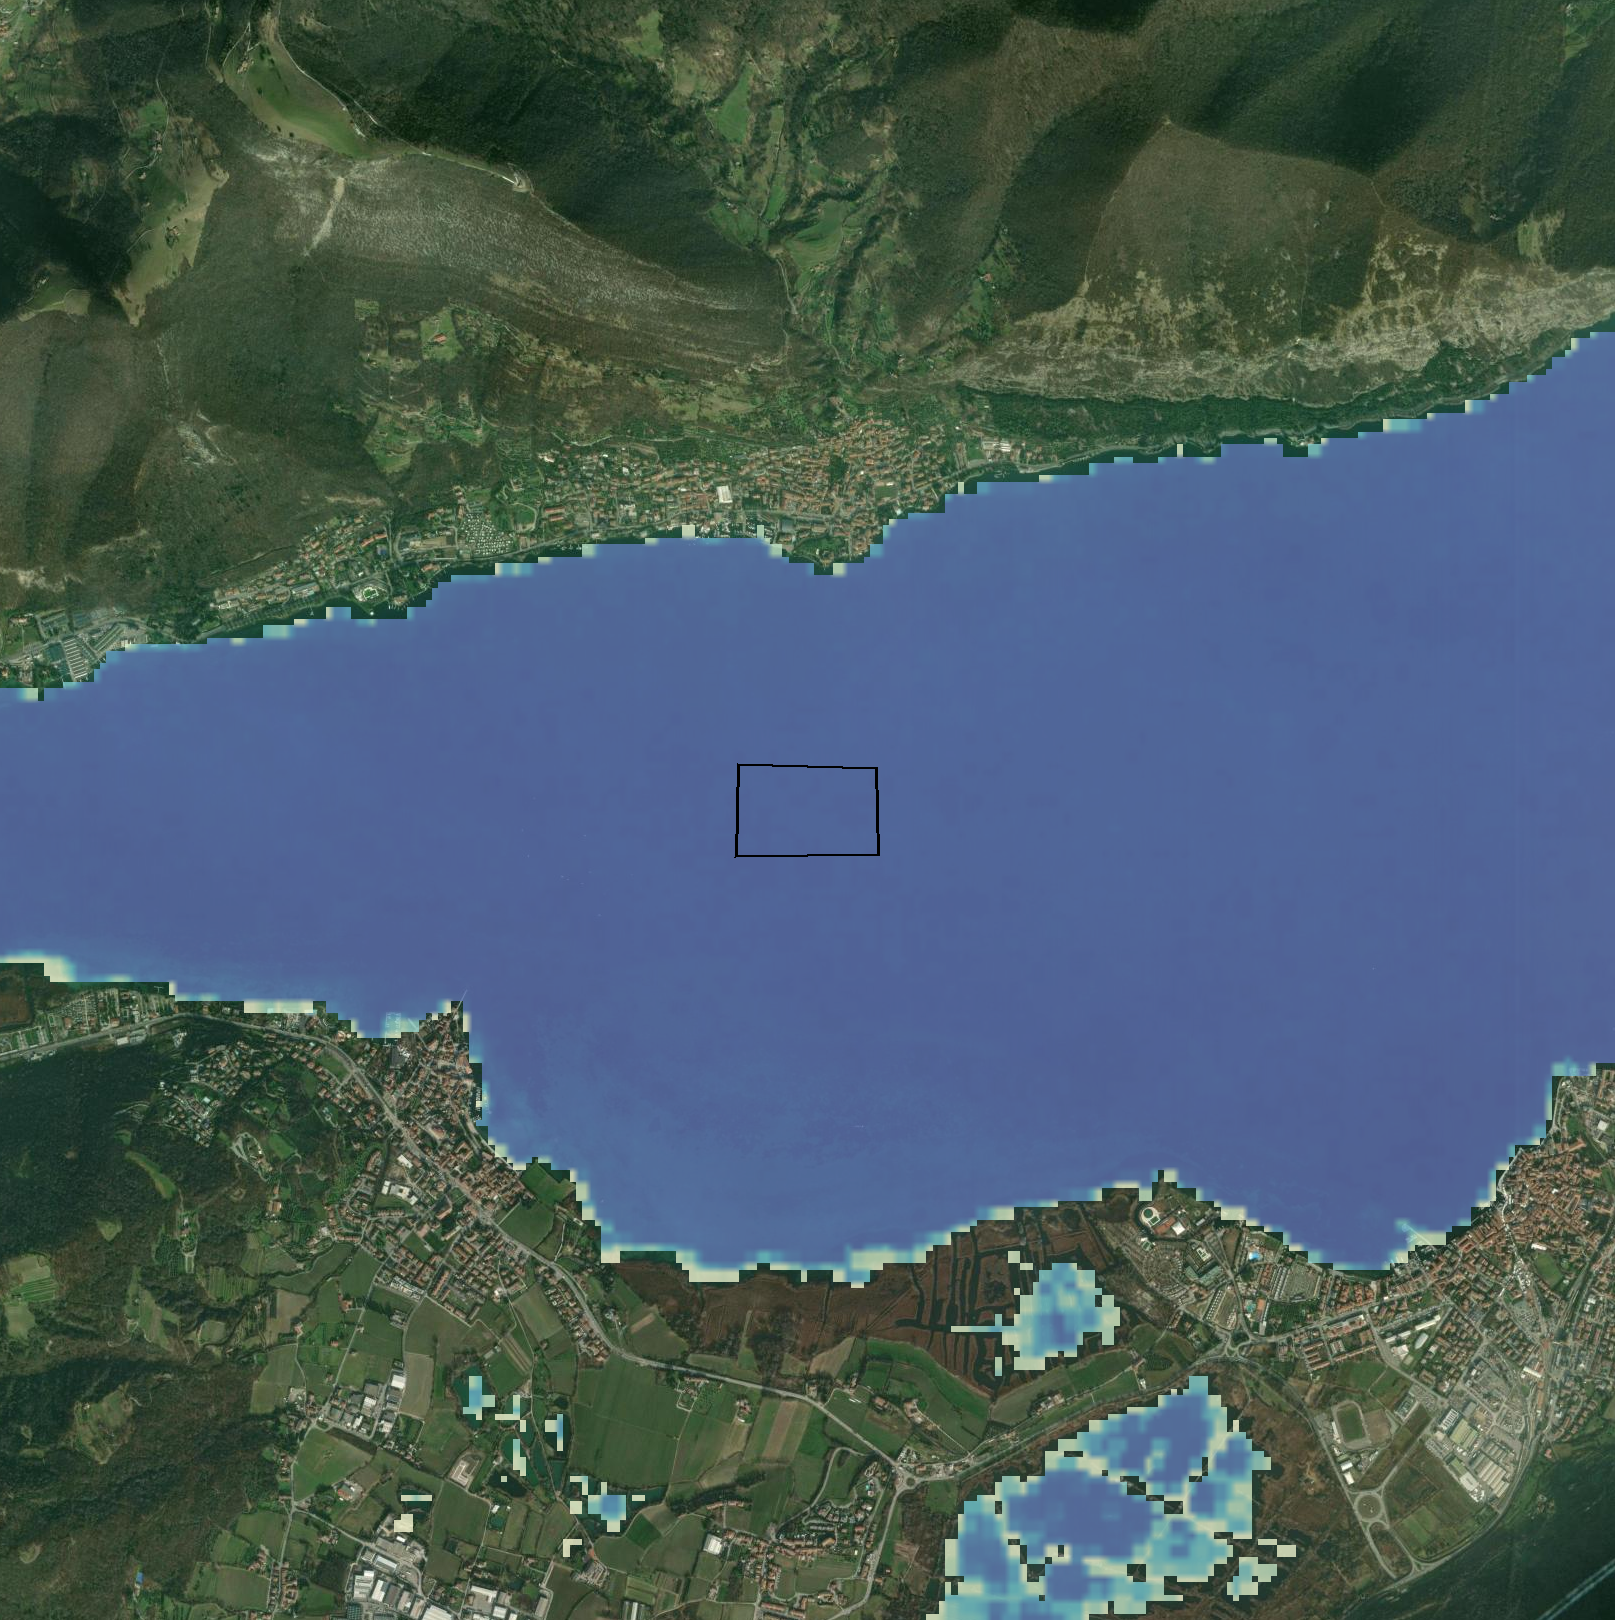
Secchi Disk Depth
Estimates water visibility depth in meters (transparency)
4.00 credits/per_km2secchi_depth
Documentation
Maps
Secchi Disk Depth Annual Range
Annual mean of water transparency over the selected period
5.00 credits/per_km2secchi_depth_range
Documentation
Maps
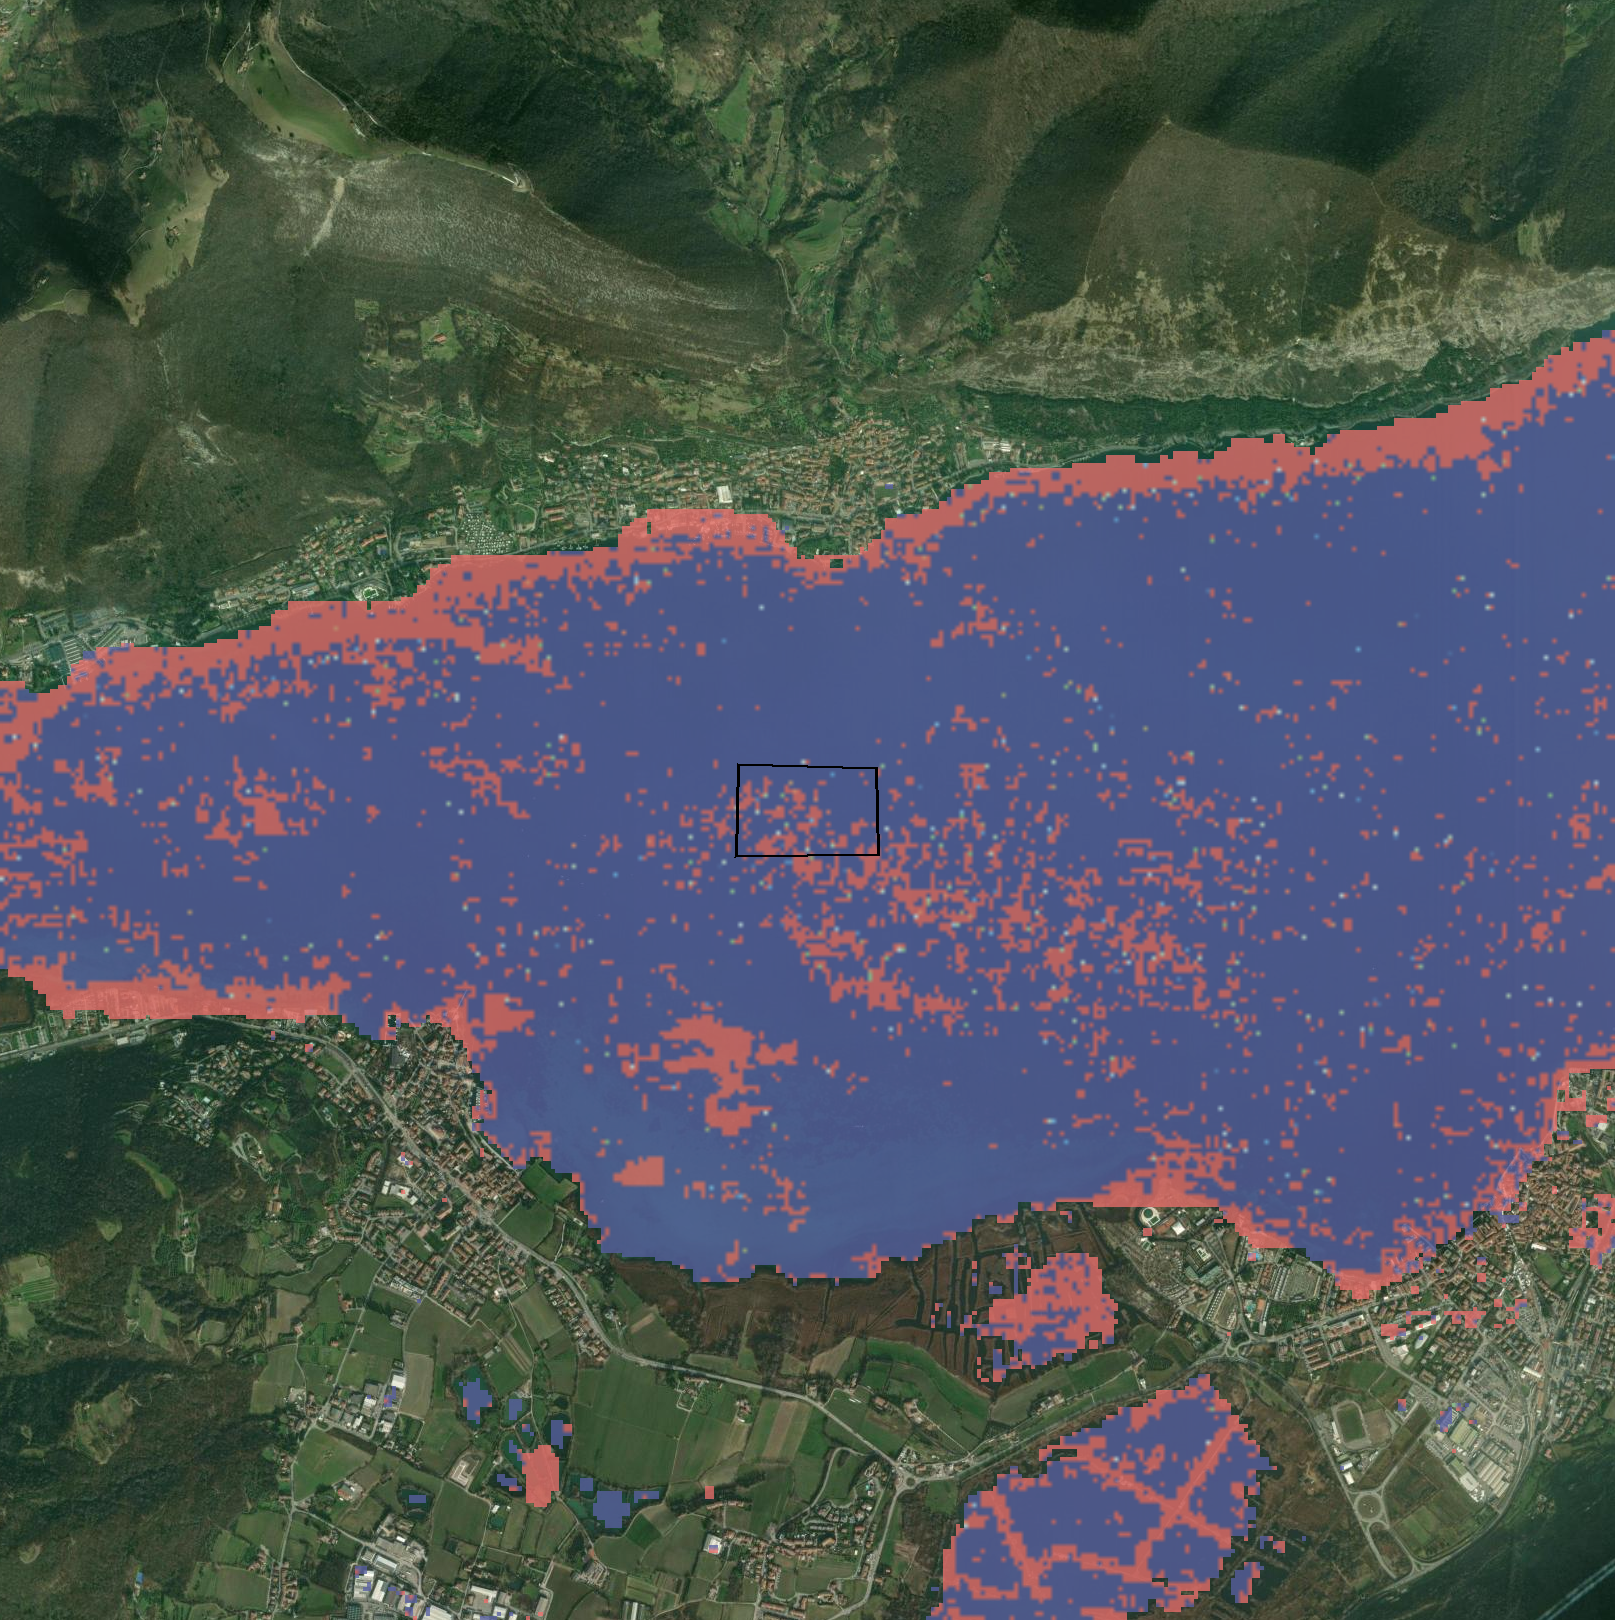
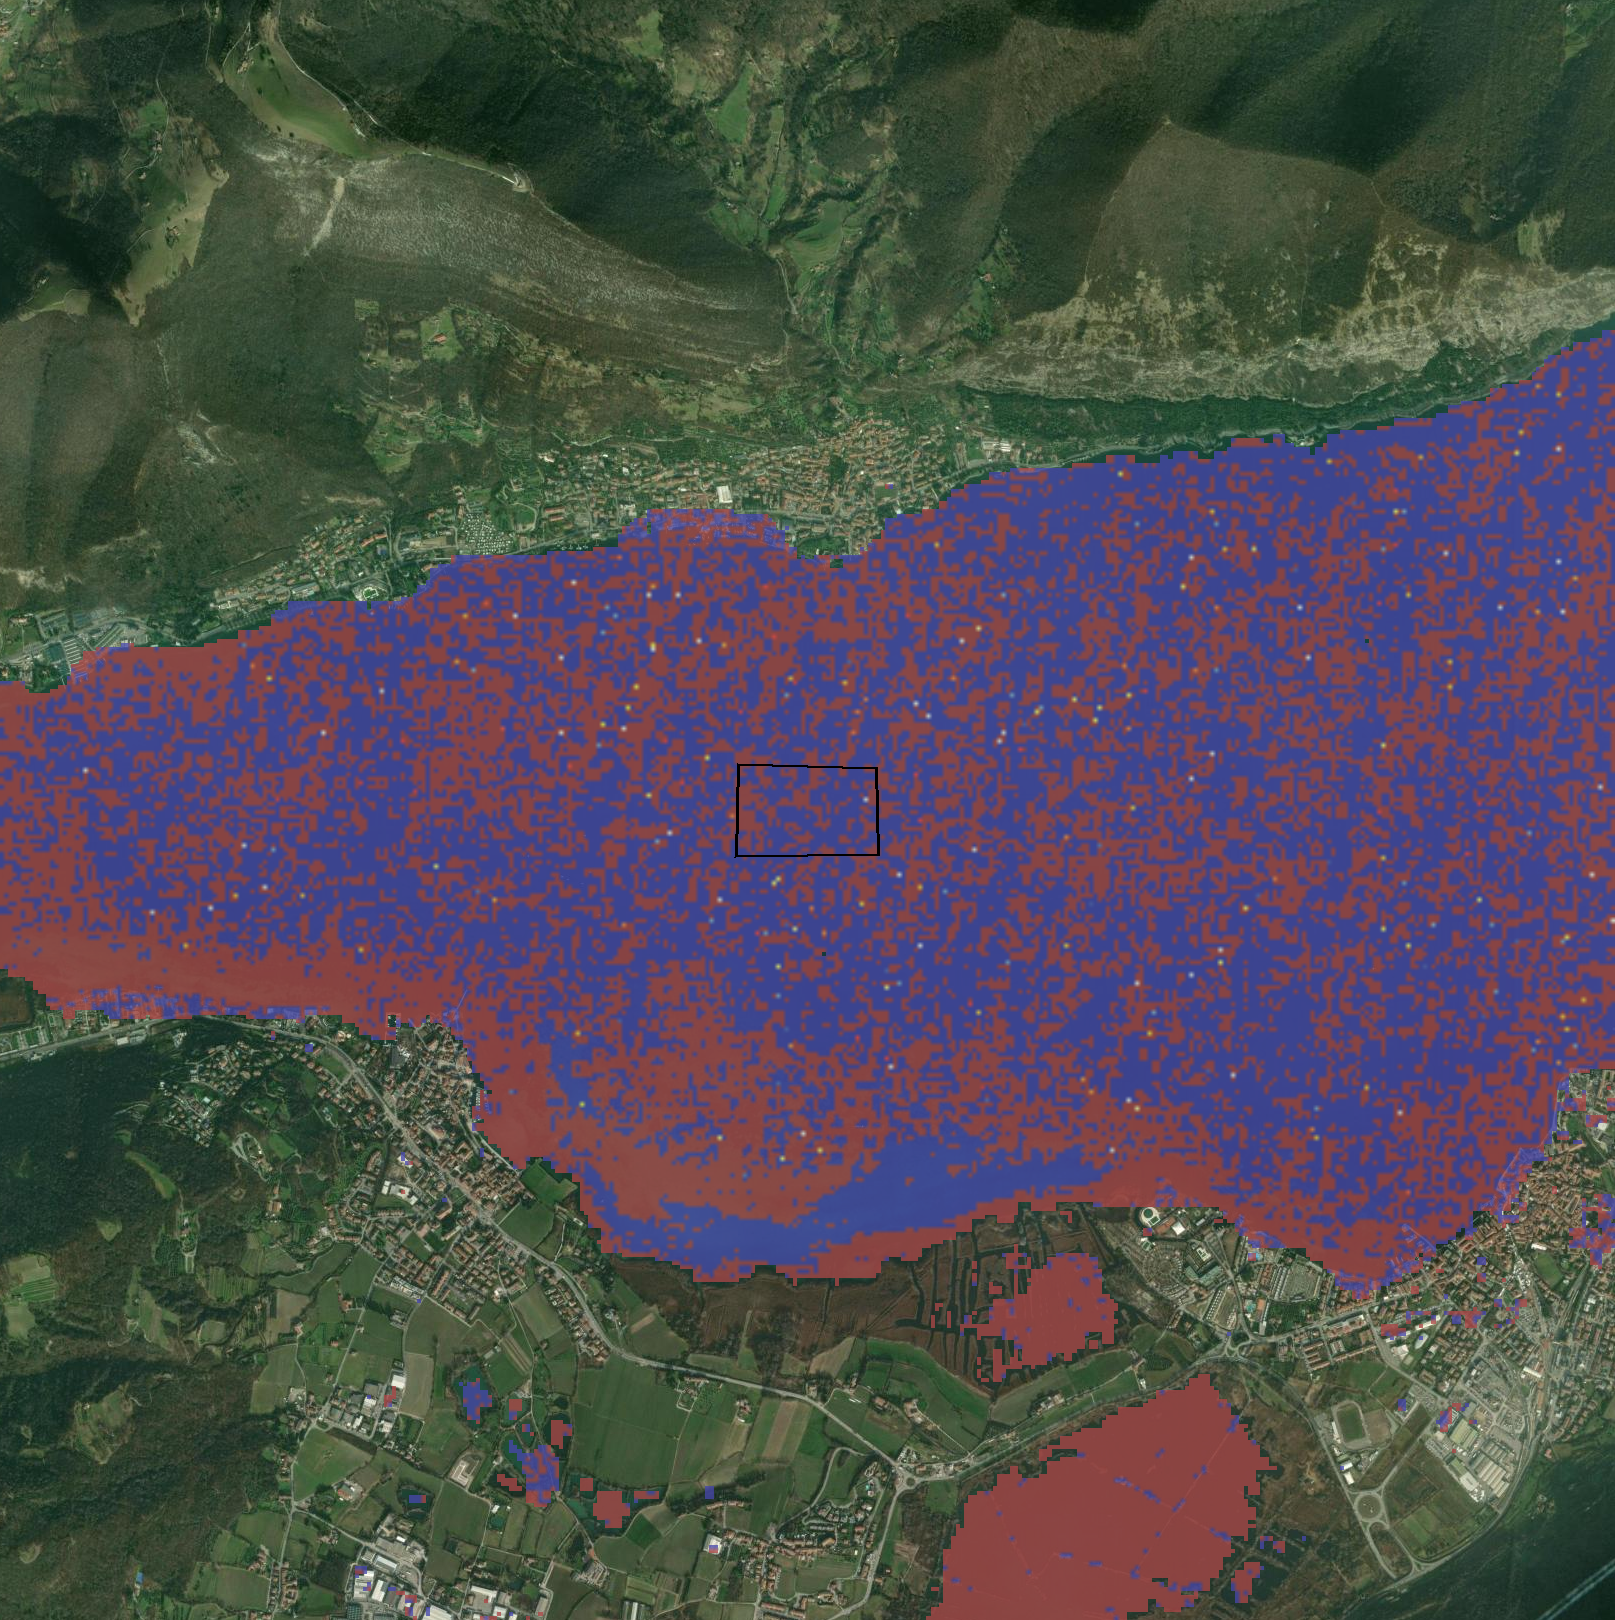
Floating Algae (FAI)
Detects floating algae and aquatic vegetation on water surface
4.00 credits/per_km2floating_algae
Documentation
Maps
Floating Algae (FAI) Annual Range
Annual mean of floating algae over the selected period
5.00 credits/per_km2floating_algae_range
Documentation
Maps
Floating Algae (FAI) Range Delta
Floating algae change between two annual periods
6.00 credits/per_km2floating_algae_range_delta
Documentation
Maps
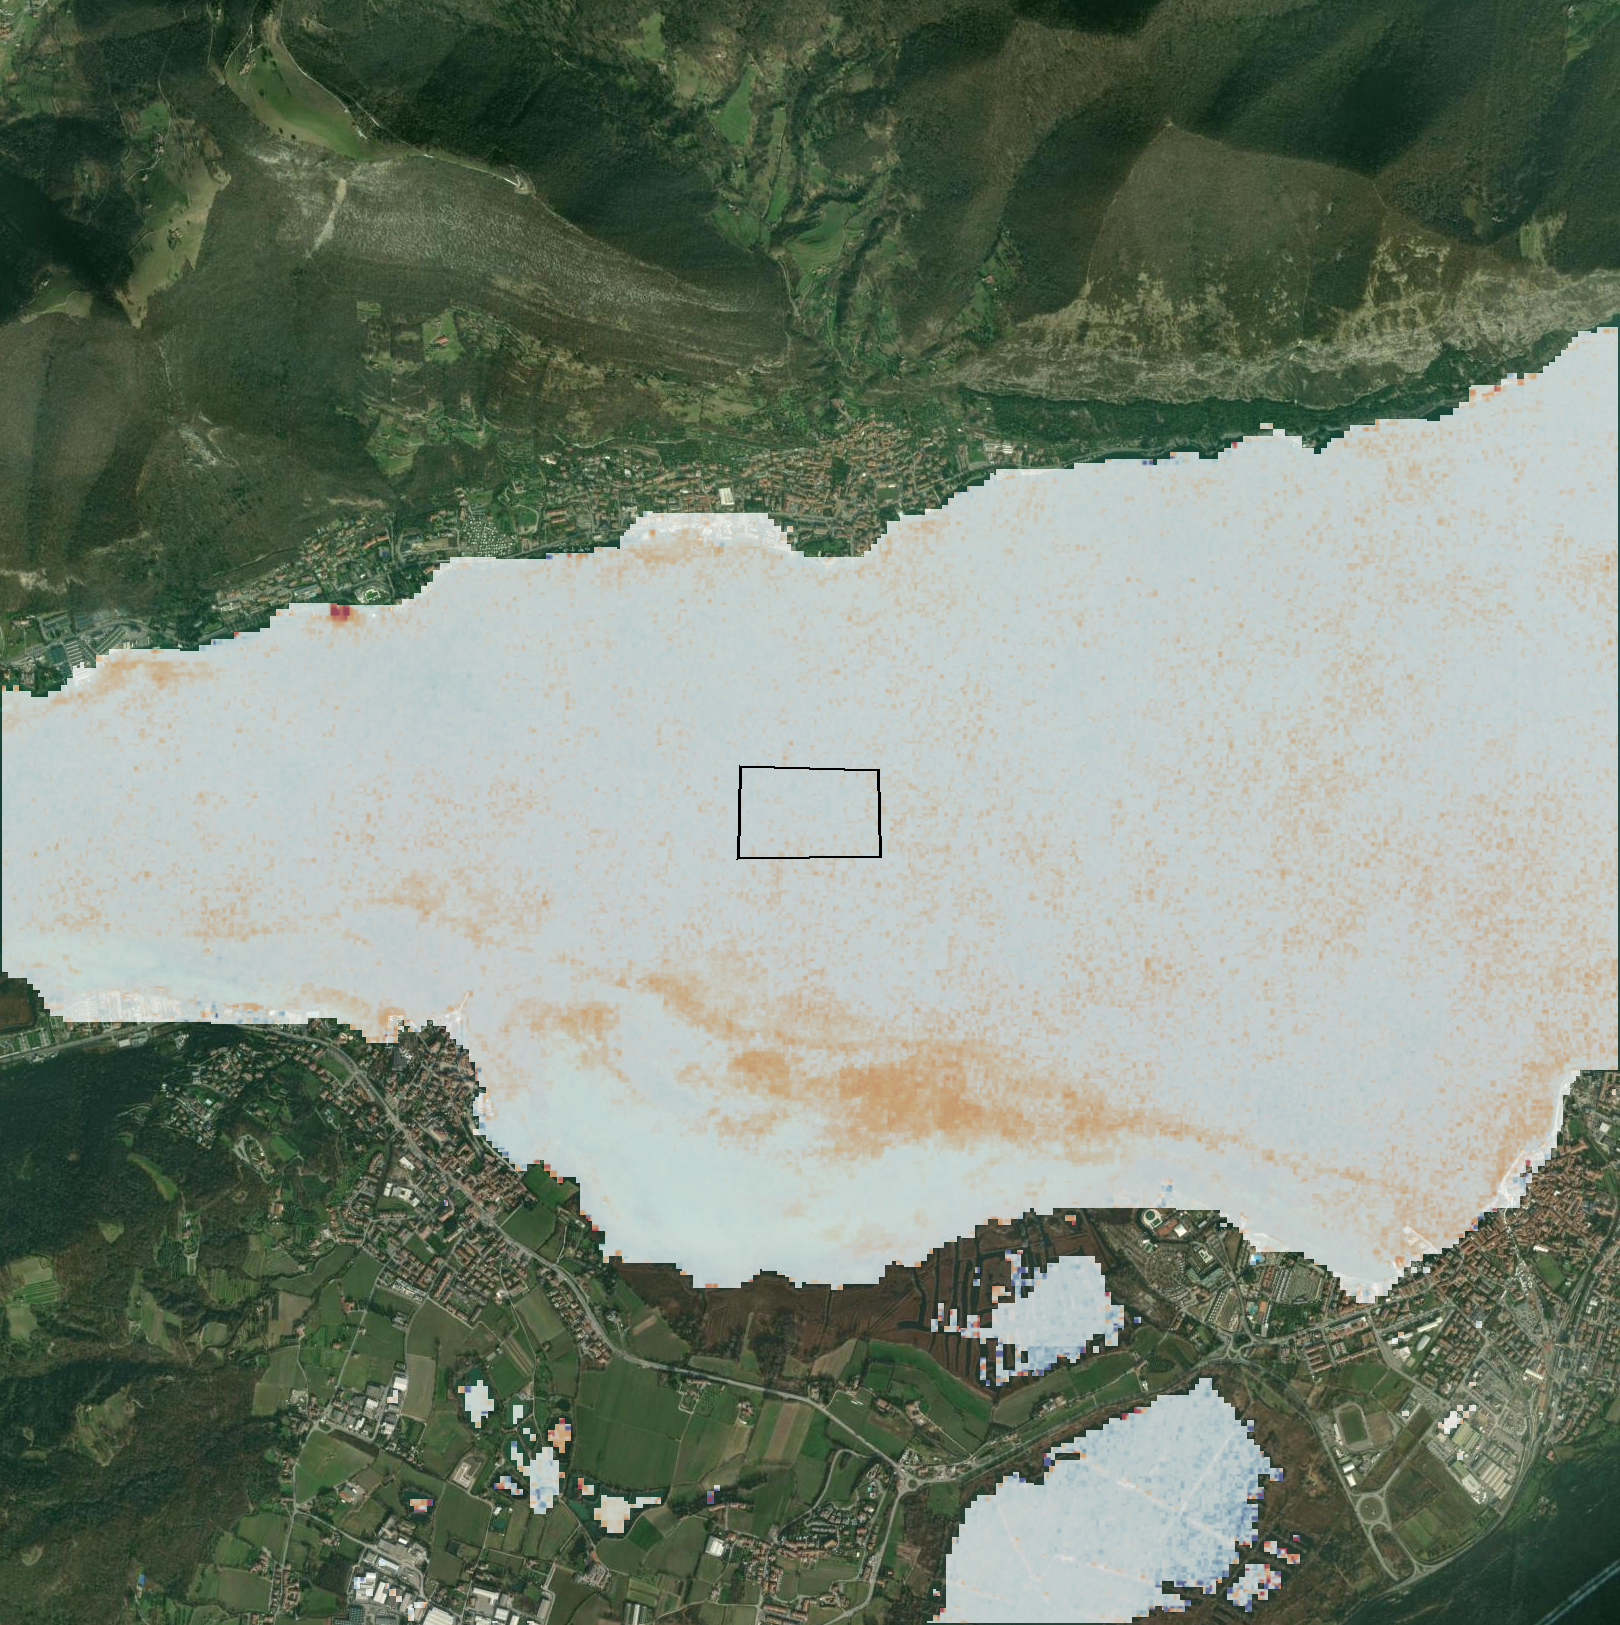
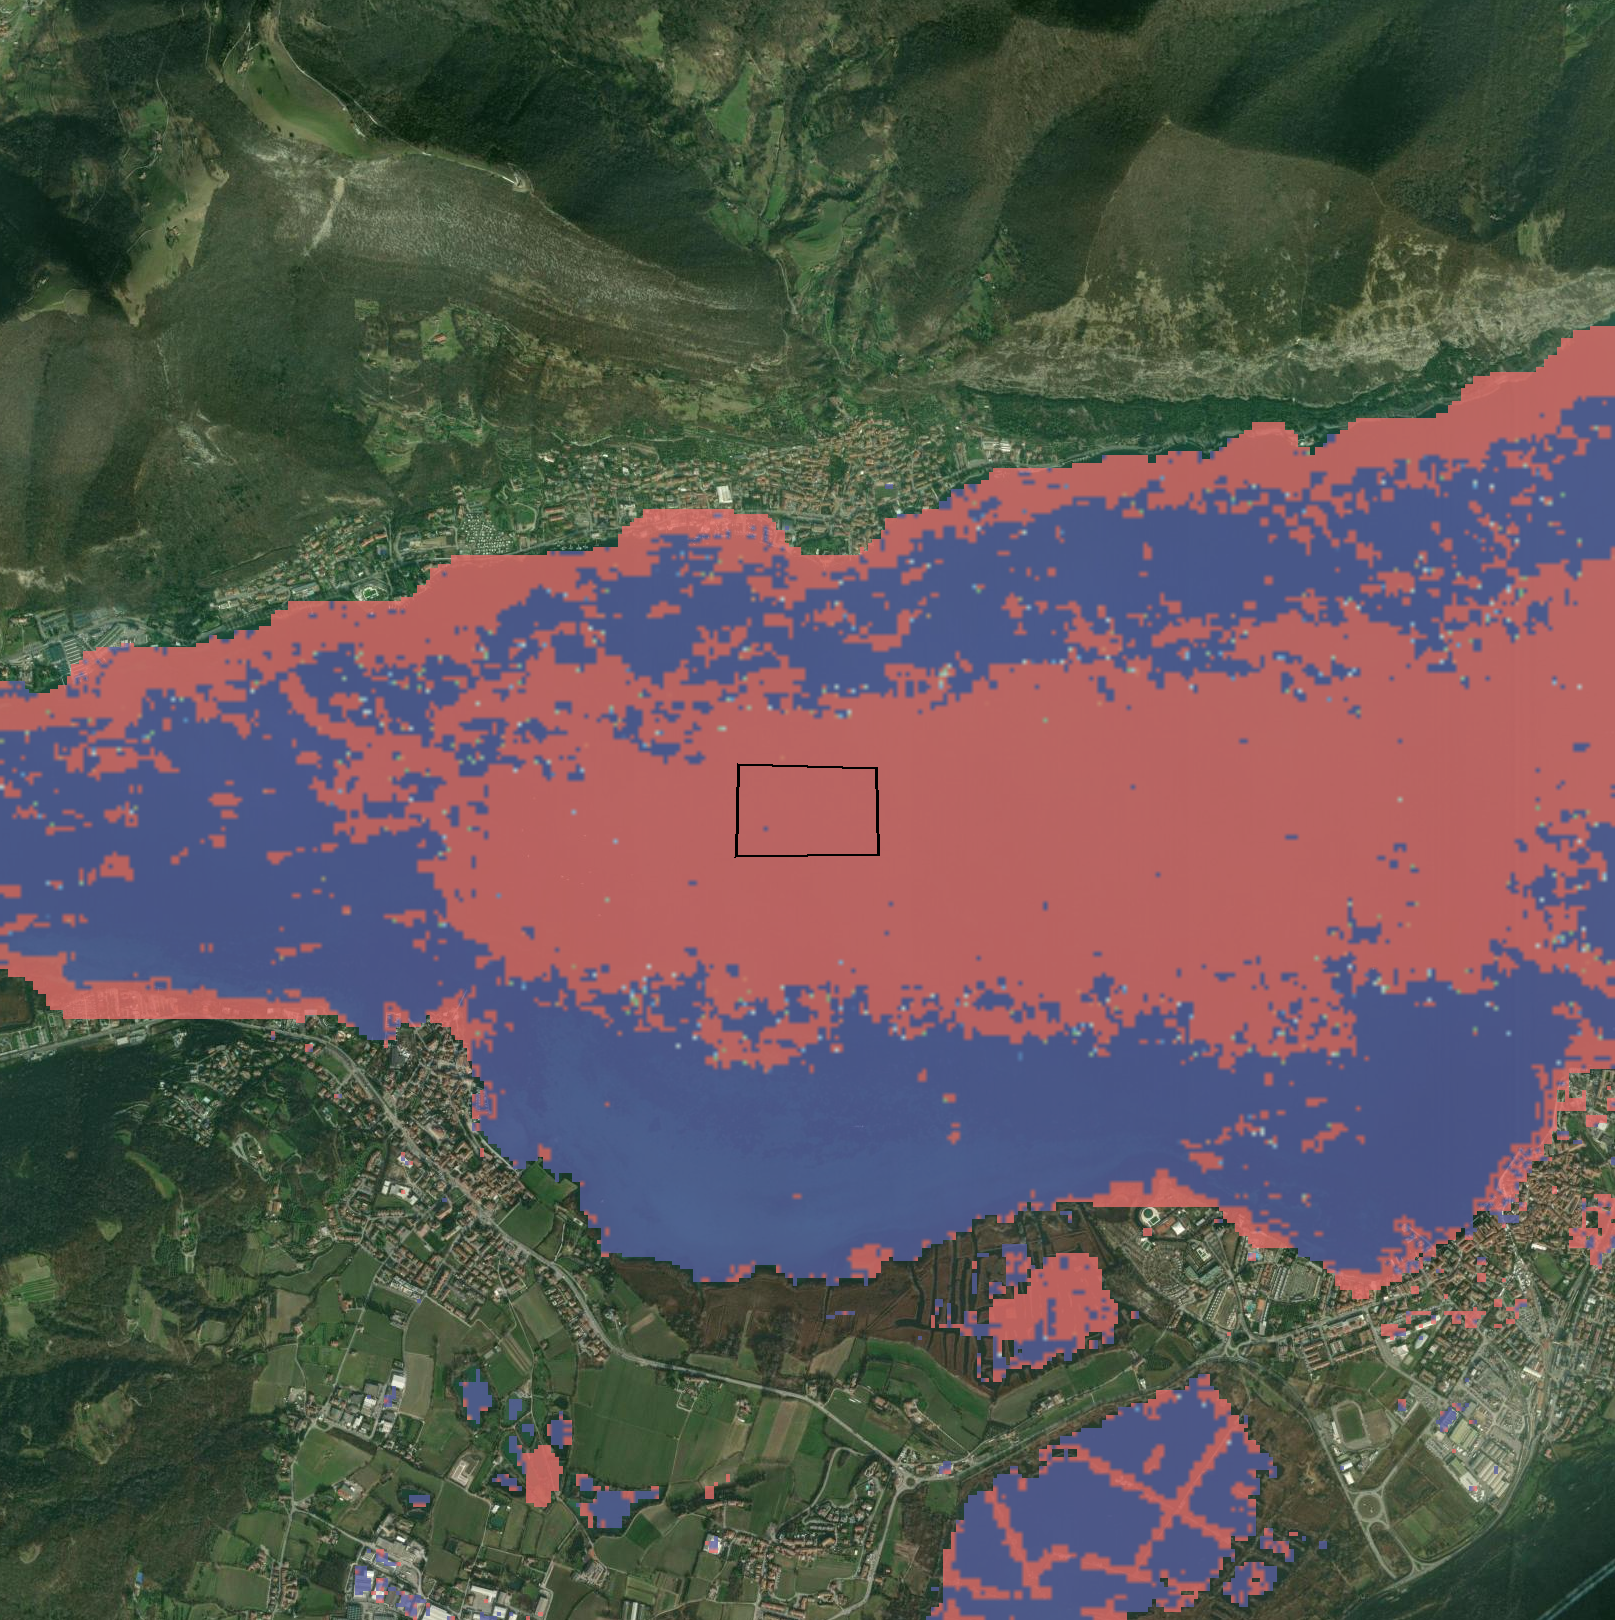
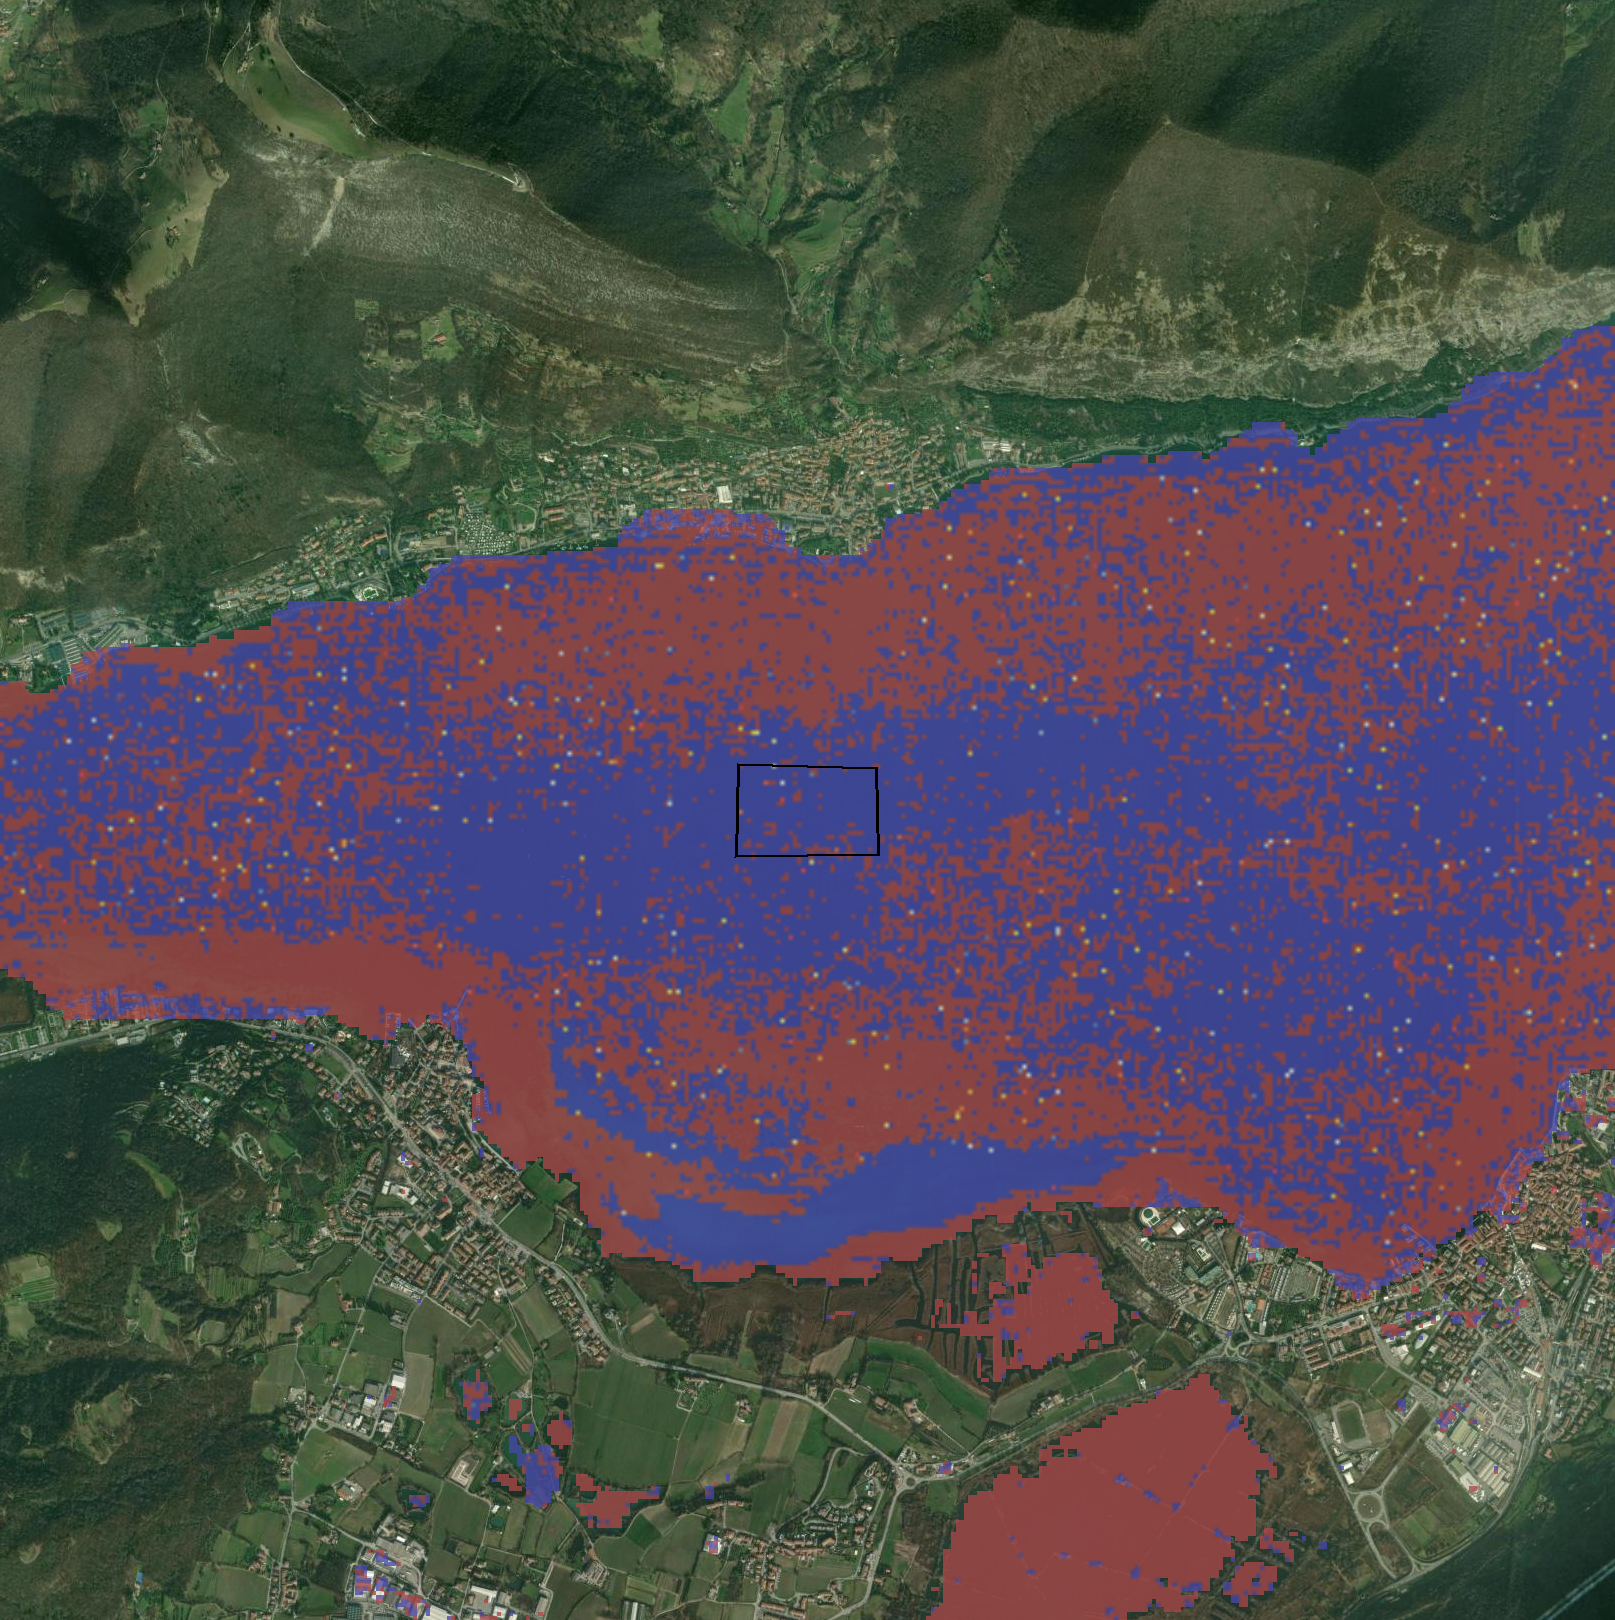
Algal Bloom Intensity (MCI)
Maximum Chlorophyll Index - detects and quantifies intense algal blooms
4.00 credits/per_km2algal_bloom_intensity
Documentation
Maps
Algal Bloom Intensity (MCI) Annual Range
Annual mean of algal bloom intensity over the selected period
5.00 credits/per_km2algal_bloom_intensity_range
Documentation
Maps
Water Occurrence
Percentage of time water was detected (1984-2021, JRC, 30m)
2.00 credits/per_km2water_occurrence
Documentation
Maps
Surface Water Transition
Changes in surface water over time (permanent, seasonal, lost, new)
2.00 credits/per_km2surface_water_transition
Documentation
Maps
Infant Mortality
Subnational infant mortality rate (deaths per 1,000 live births, CIESIN 2015 data)
2.00 credits/per_km2infant_mortality
Maps
Biodiversity Intactness
Proportion of original biodiversity remaining (BII). Values near 1 indicate pristine ecosystems.
2.00 credits/per_km2biodiversity_intactness
Documentation
Maps
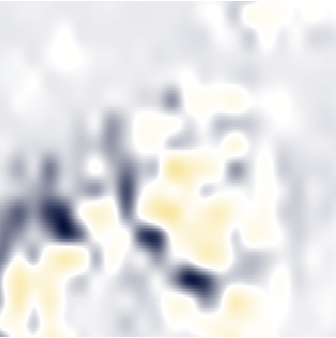
Human Footprint
Cumulative human pressure on ecosystems (0–1 scale). Combines infrastructure, land use, population density, and night lights.
2.00 credits/per_km2human_footprint
Documentation
Maps
Soil Erosion (2020)
Classification of soil loss by water erosion (RUSLE, 2020 data)
2.00 credits/per_km2soil_erosion
Documentation
Maps
Soil Organic Carbon
Soil organic carbon content in the topsoil layer (0–30cm depth). Higher values indicate richer, healthier soils with greater carbon sequestration potential.
2.00 credits/per_km2soil_carbon
Documentation
Maps
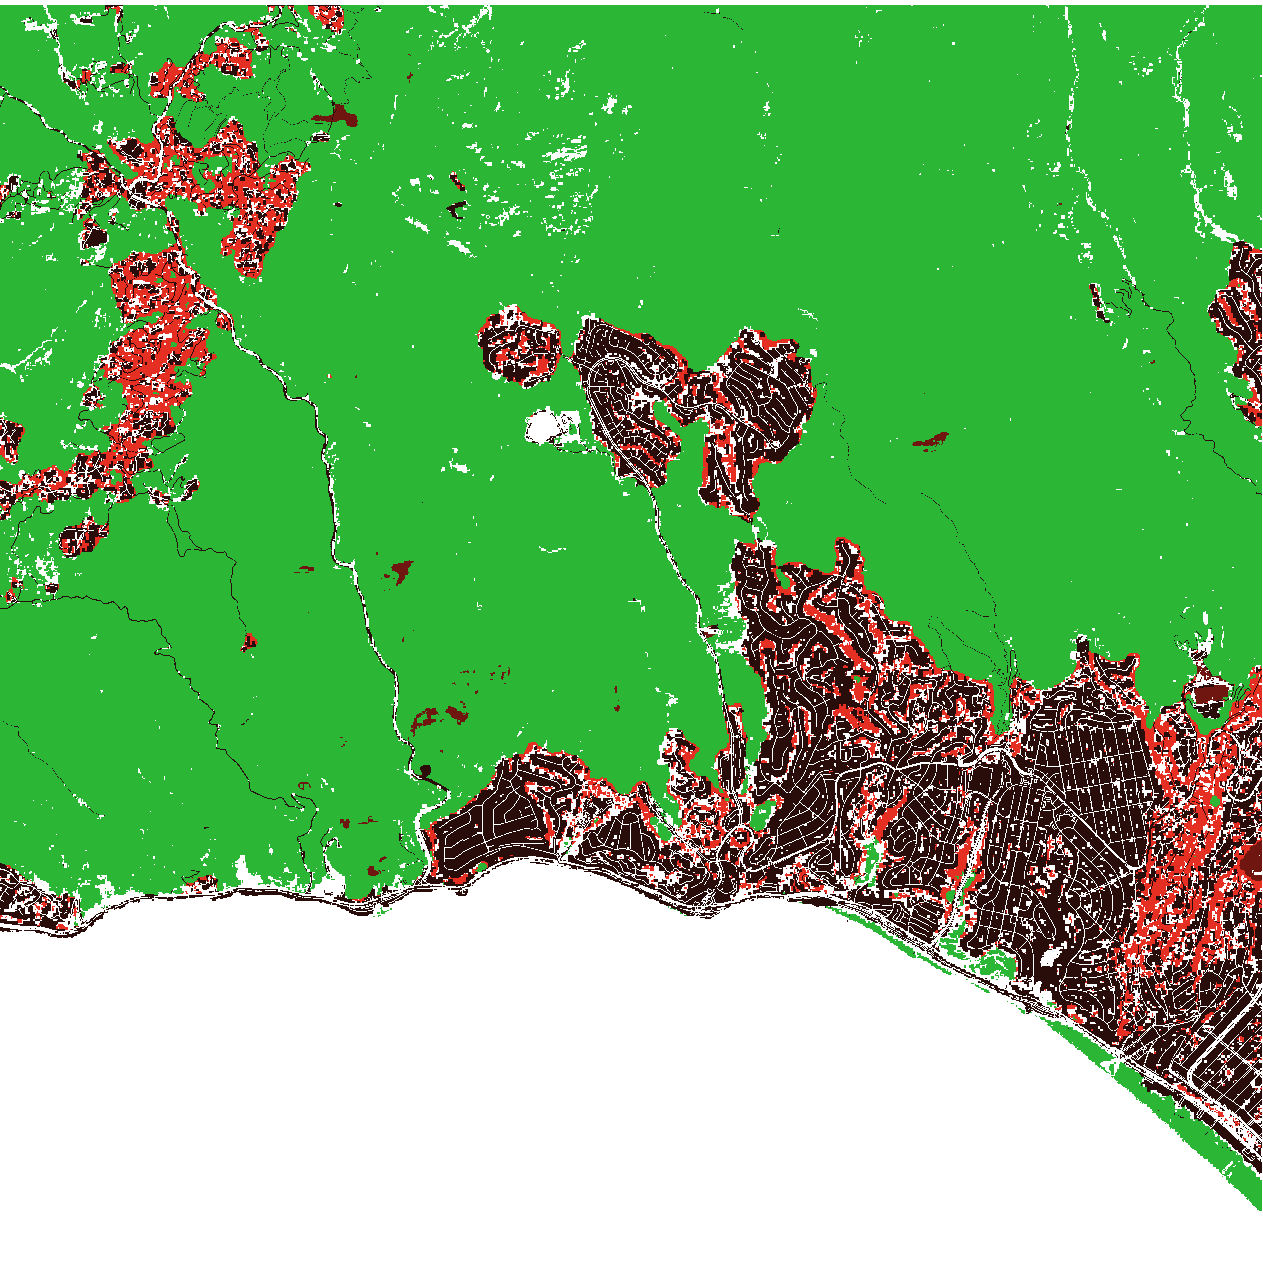
Tree Cover Loss
Pixel-level deforestation history (2001–2023). Each pixel records the year tree cover was lost.
2.00 credits/per_km2tree_cover_loss
Documentation
Maps
Tree Cover Height
Tree cover canopy height in meters (WRI DataLab, 10m)
2.00 credits/per_km2tree_cover_height
Documentation
Maps
Forest GHG Net Flux
Net greenhouse gas flux from forests. Negative = carbon sink, positive = carbon source. Units: Mg CO₂e/ha/yr.
2.00 credits/per_km2forest_ghg_flux
Documentation
Maps
GLAD Deforestation Alerts
Near-real-time deforestation alerts (UMD GLAD, 30m)
2.00 credits/per_km2glad_alerts
Documentation
Maps
Cumulative Tree Cover Gain
Cumulative tree cover gain (WRI DataLab, 5m)
2.00 credits/per_km2cumulative_tree_cover_gain
Documentation
Maps
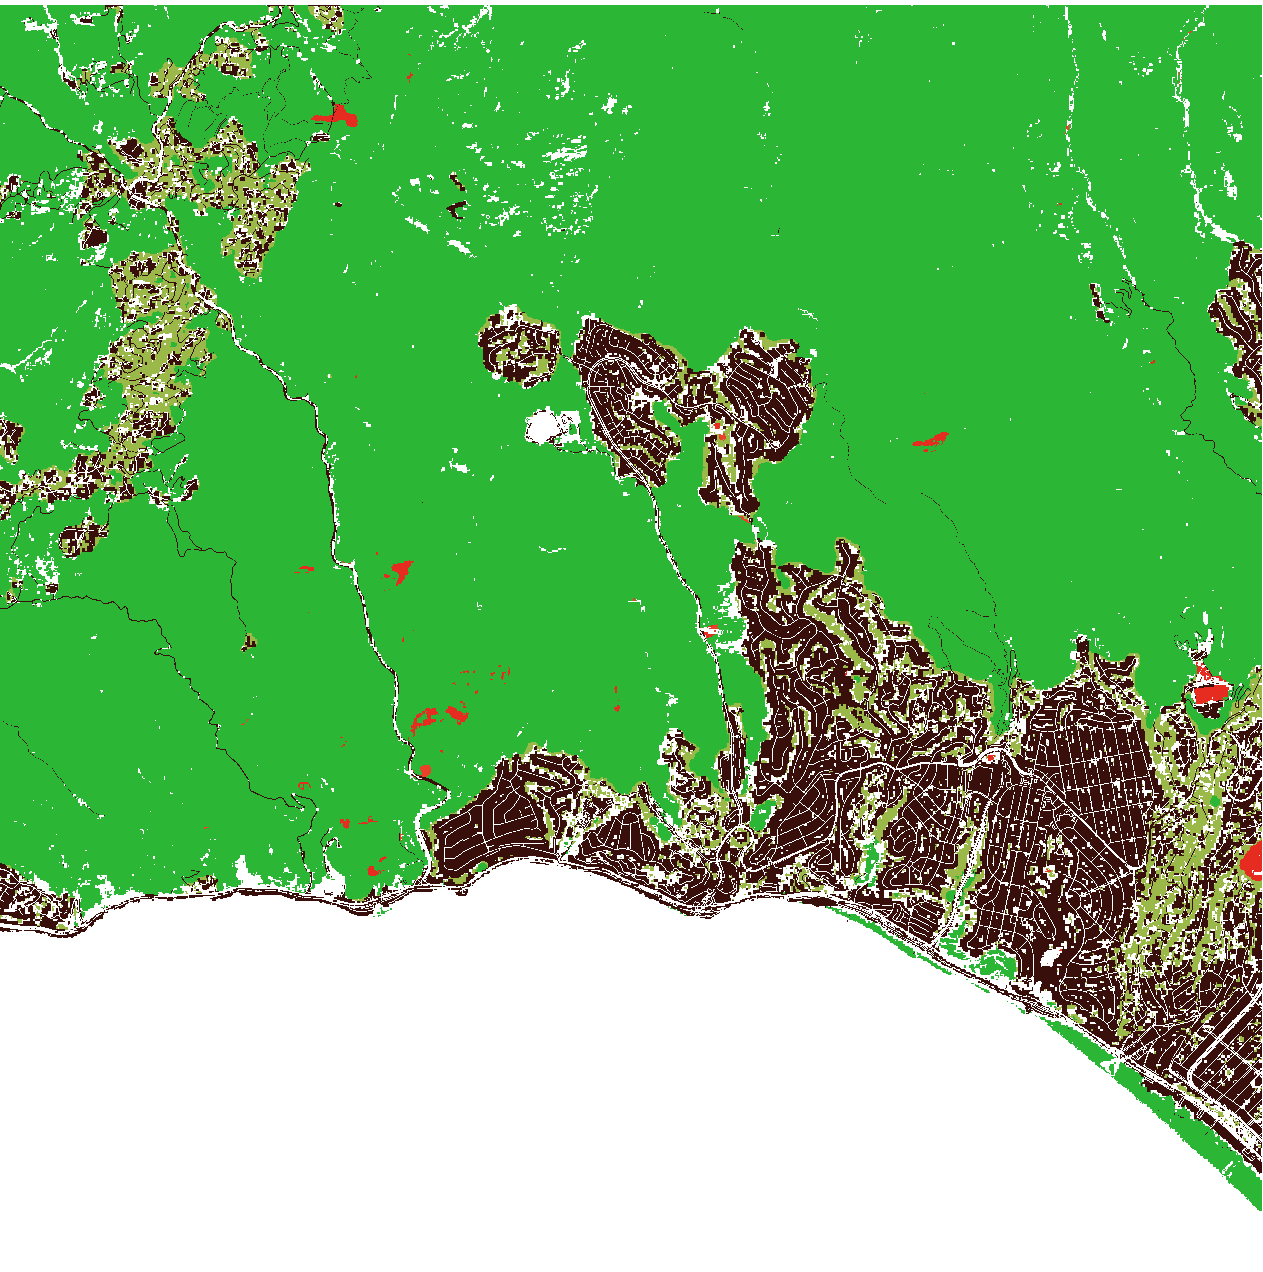
Forest Height Change
Change in forest canopy height at 30m resolution. Shows tree growth (gain) and height loss (logging, storms).
2.00 credits/per_km2forest_height_change
Documentation
Maps
Impervious Surfaces (2015)
Percentage of impervious surface cover per pixel (30m)
2.00 credits/per_km2impervious_surfaces
Documentation
Maps
Erosion Risk
Soil erosion risk classification (RUSLE, 2020 data)
2.00 credits/per_km2erosion_risk
Maps
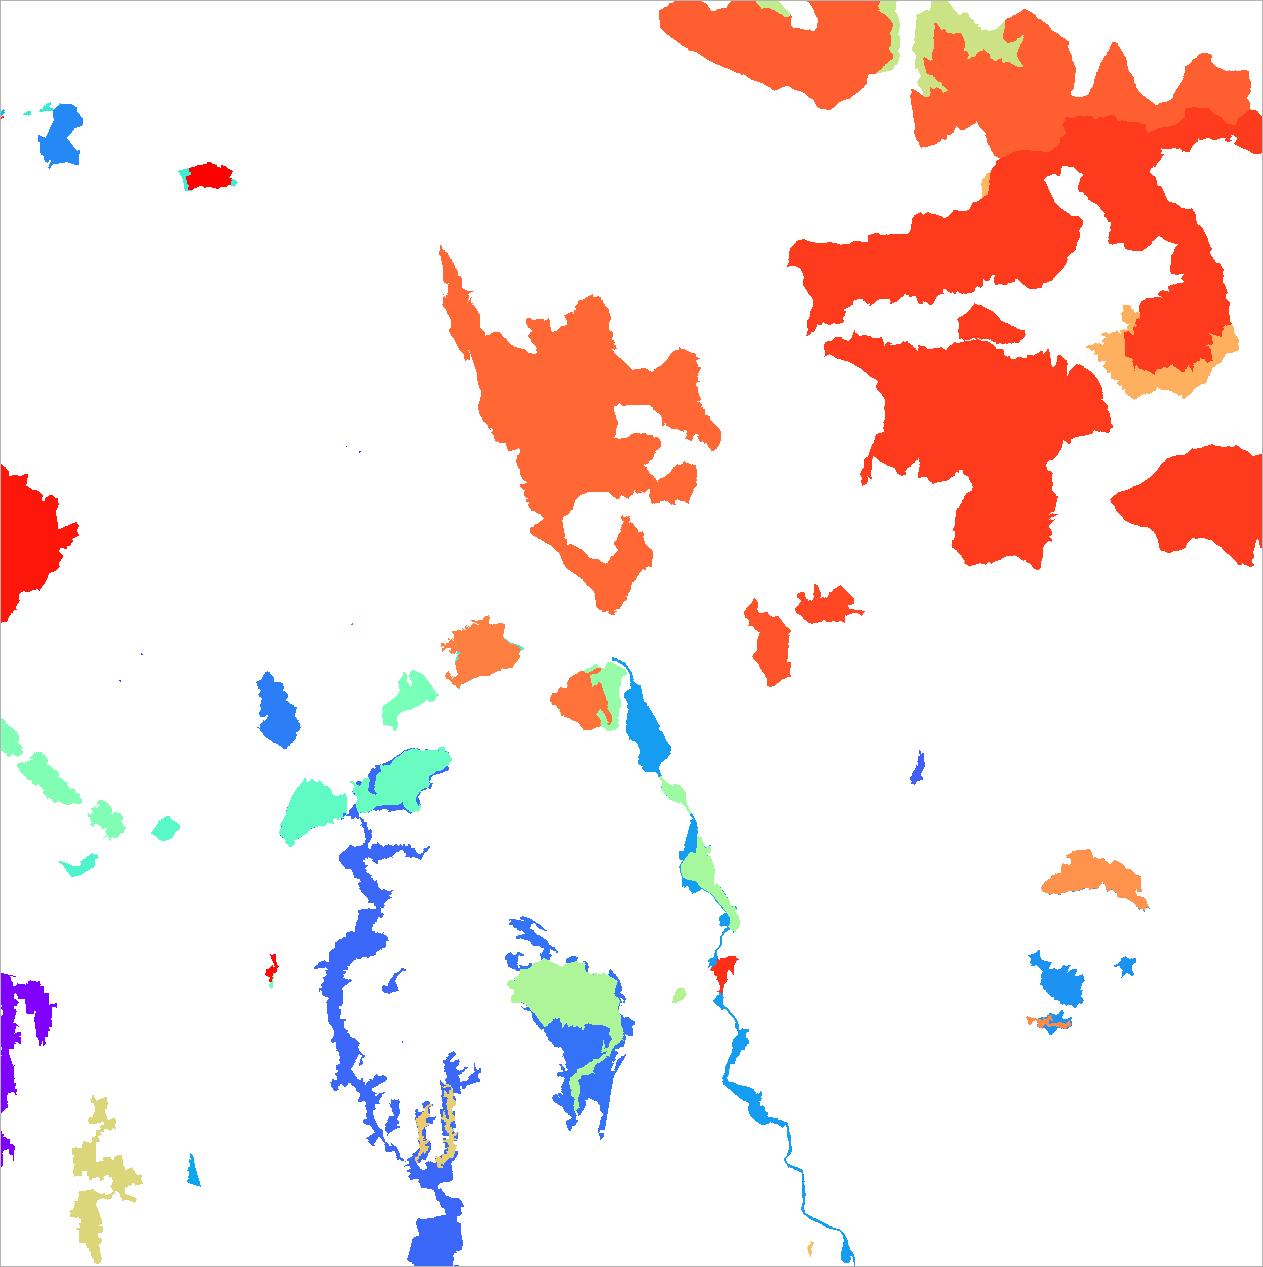
Wetlands & Waterbodies
Global wetland extent from GLWD-3 (11 classes): lakes, reservoirs, rivers, marshes, swamp forests, coastal wetlands, bogs.
2.00 credits/per_km2wetlands
Documentation
Maps
Urban Built-Up Area
Shows when each pixel was first built-up across four time periods (before 1975, 1975-1990, 1990-2000, 2000-2020)
3.00 credits/per_km2bua
Maps
Forest Restoration Opportunity
Forest landscape restoration opportunities (~1km). Classes: wide-scale, mosaic, remote restoration.
forest_restoration
Maps
Potential Natural Vegetation
What would grow without human interference. 15 biome classes (Ramankutty & Foley 1999). Restoration benchmark.
potential_vegetation
Maps
Species Richness
Combined amphibian and mammalian species richness at ~10km resolution. Each cell shows total known species count.
species_richness
Maps
PM2.5 Air Quality
Annual mean fine particulate matter (PM2.5) at ~10km. WHO guideline: <5 μg/m³. Values >25 indicate unhealthy air.
pm25
Documentation
Maps
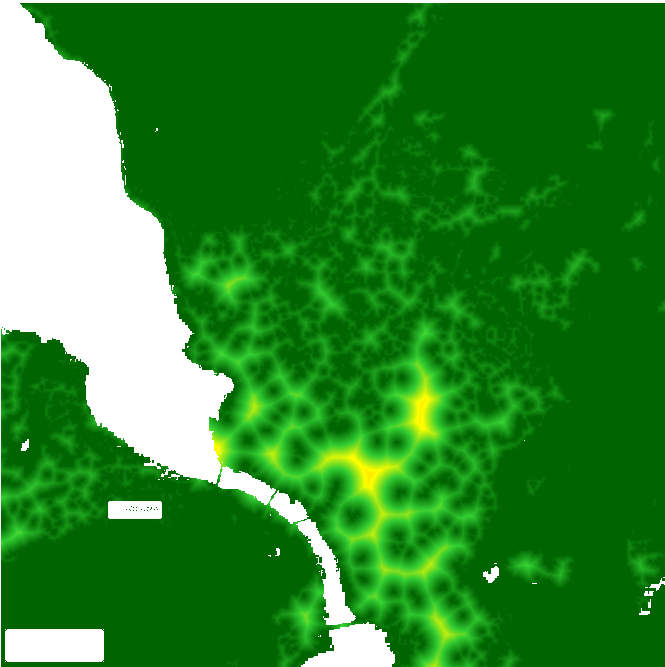
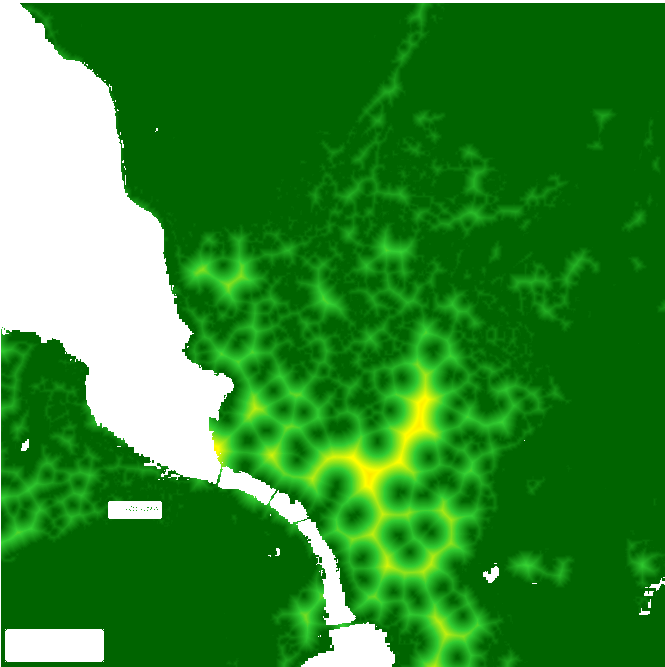
Accessibility to Cities
Travel time to the nearest city (>50,000 pop) in minutes. Low = urban/accessible, high = remote. 2015 snapshot.
accessibility_to_cities
Documentation
Maps
Gridded GDP
Gridded total GDP per capita at ~10km resolution (2015). Derived from national accounts and sub-national GDP estimates. Values in millions USD PPP.
gridded_gdp
Documentation
Maps
GDP Per Capita
National GDP per capita gridded at ~10km (2015). World Bank PPP estimates. Useful for socioeconomic context of biodiversity sites.
gdp_per_capita
Documentation
Maps
Population Density
Gridded population estimates at ~100m resolution (WorldPop, 2020). Total population count per grid cell.
population_density
WebGIS
Buffer
Create a buffer zone around geometries
0.20 credits/flatwebgis_buffer
WebGIS
Union
Merge all features into a single geometry
0.10 credits/flatwebgis_union
WebGIS
Simplify
Reduce geometry complexity while preserving shape
0.10 credits/flatwebgis_simplify
WebGIS
Bounding Box
Calculate the bounding box of all features
0.10 credits/flatwebgis_bbox
WebGIS
Convex Hull
Calculate the convex hull of all features
0.10 credits/flatwebgis_hull
WebGIS
Centroid
Calculate the centroid of all features
0.10 credits/flatwebgis_centroid
WebGIS
Dissolve
Merge features by a shared property
0.20 credits/flatwebgis_dissolve
WebGIS
Split
Split multi-geometries into individual features
0.10 credits/flatwebgis_split
Maps
Water Bodies
Rivers, lakes, canals and seas from OpenStreetMap
0.50 credits/per_km2water_bodies
Documentation
NatureGIS AI
GIS Editor Chat
AI-assisted GIS editor conversation
0.10 credits/flatgis_editor_chat
Maps
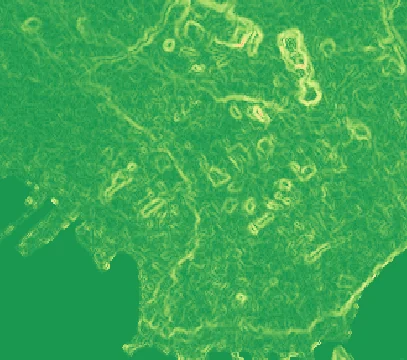
Terrain Slope
Terrain slope map in degrees (0-90), derived from the SRTM digital elevation model at 30m resolution. Useful for soil stability analysis, landslide risk, agricultural planning, and water runoff assessment.
0.50 credits/per_km2terrain_slope
Documentation
Maps
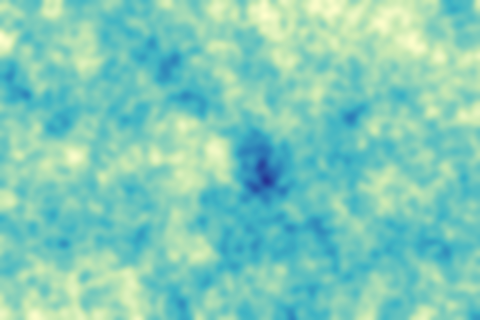
Flow Accumulation
Hydrological flow accumulation map: for each pixel, shows how many upstream pixels drain to that point. High values indicate runoff concentration (rivers, channels). Derived from the MERIT Hydro DEM at 90m.
0.50 credits/per_km2flow_accumulation
Documentation
Maps
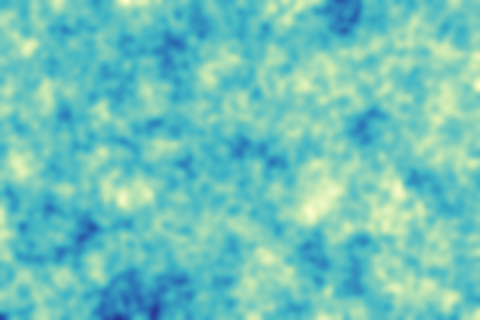
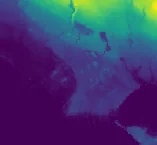
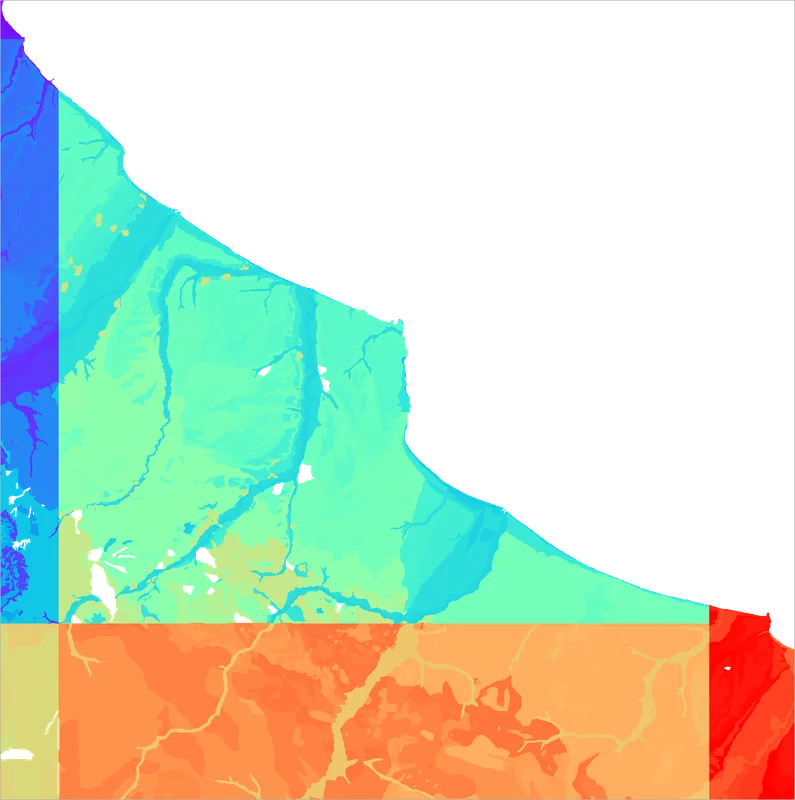
Hydro Elevation
Hydrologically conditioned digital elevation model (MERIT Hydro). Artificial depressions are filled and SRTM errors corrected to ensure continuous water flow. Resolution 90m.
0.50 credits/per_km2hydro_elevation
Documentation
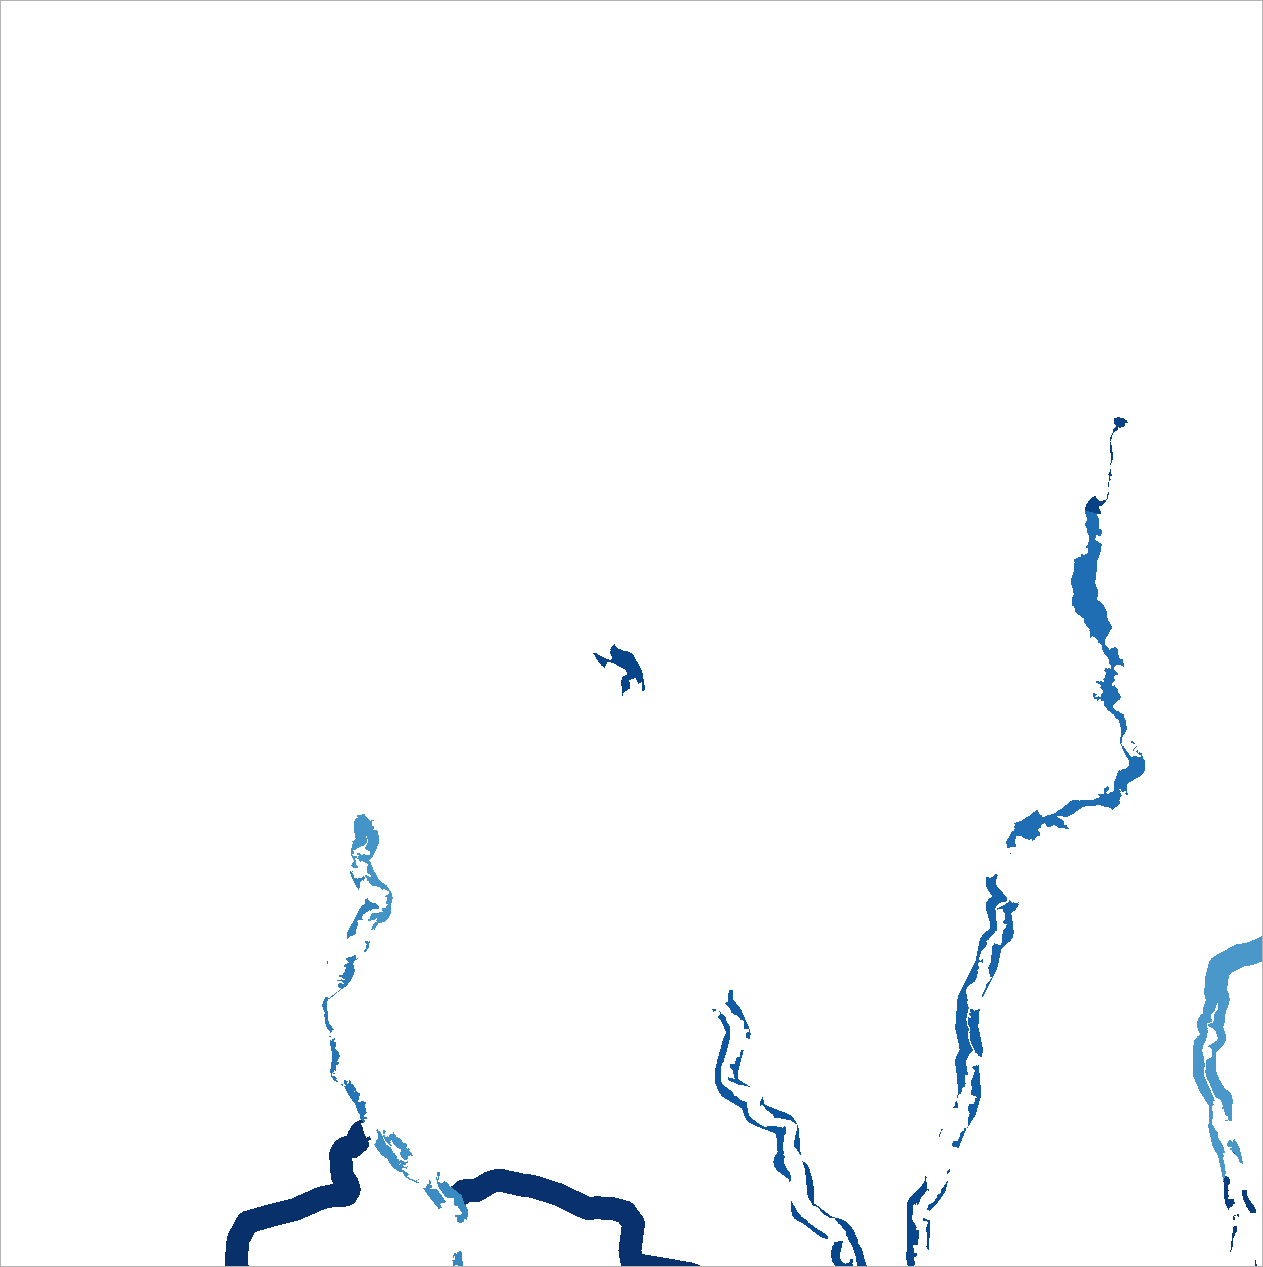
Maps
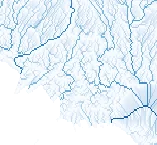
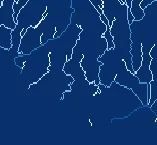
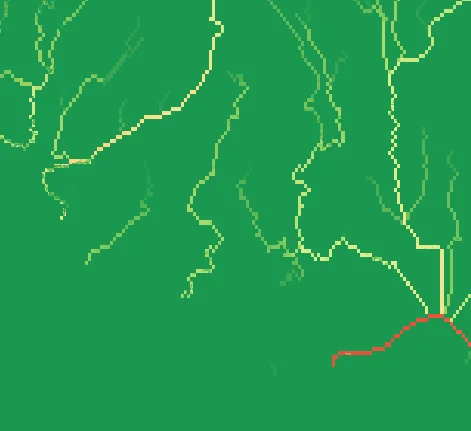
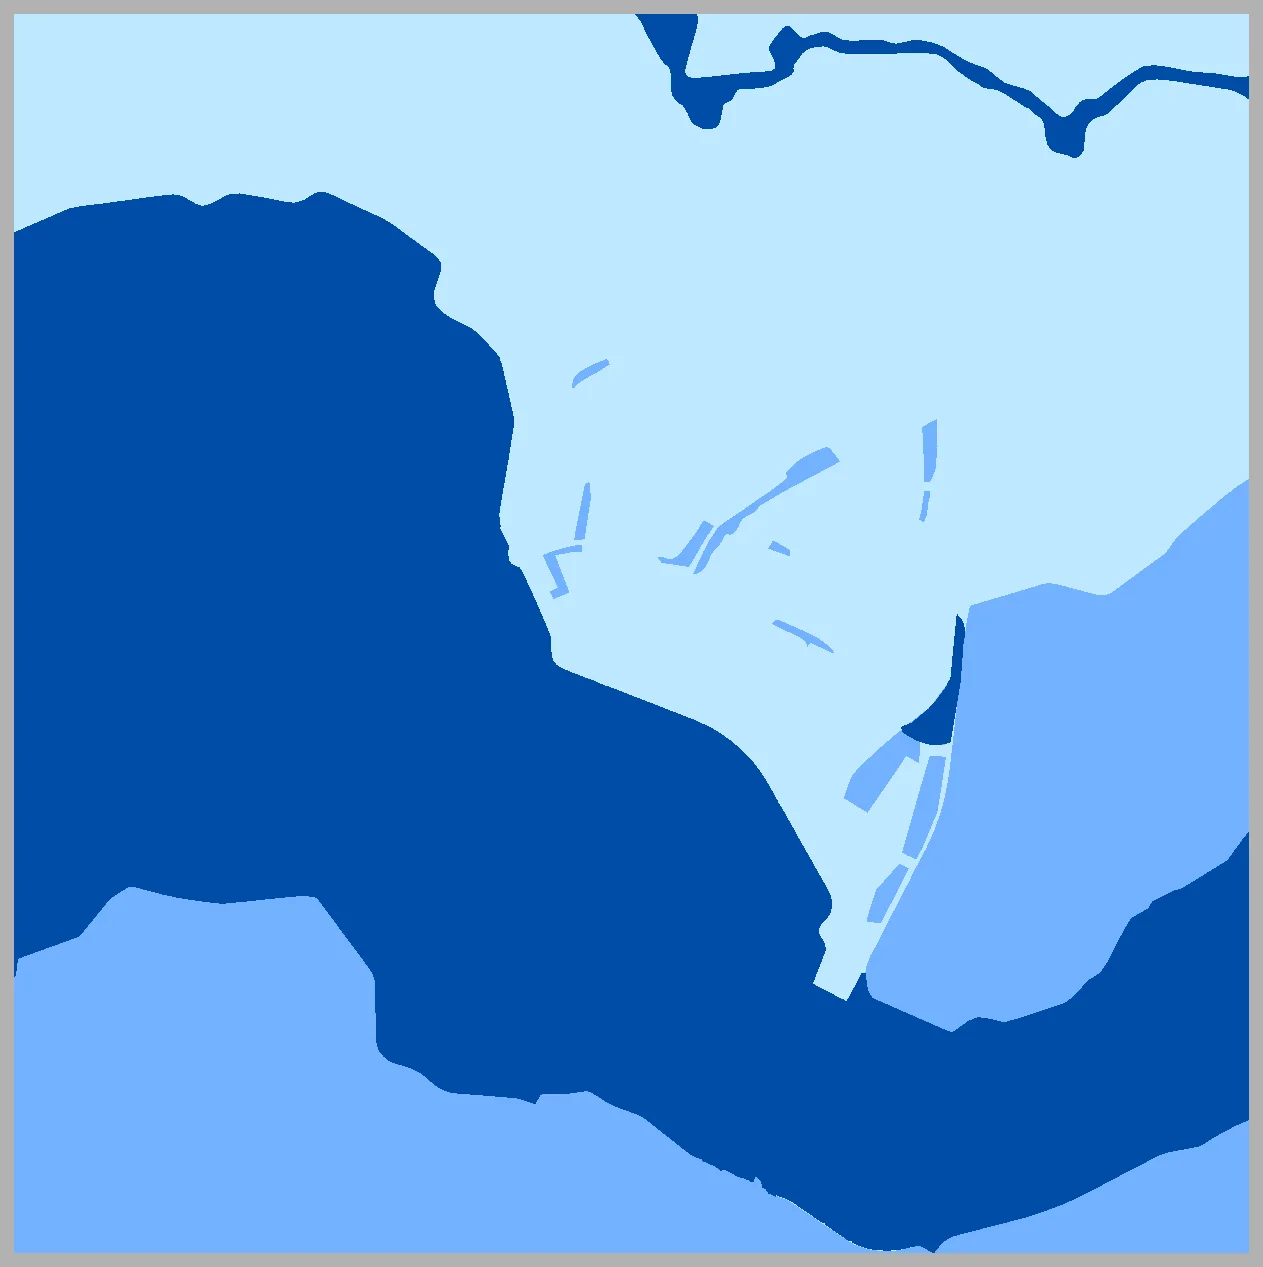
Stream Network
Stream network map derived from MERIT Hydro. Shows rivers and channels identified by thresholding upstream drainage area (>1 km2). Color indicates basin size: thin channels (light blue) to major rivers (dark blue).
0.50 credits/per_km2stream_network
Documentation
Maps
Flow Direction
D8 flow direction map: for each pixel, indicates which of the 8 adjacent pixels water flows to following the steepest descent. Derived from the MERIT Hydro DEM at 90m.
0.50 credits/per_km2flow_direction
Documentation
Maps
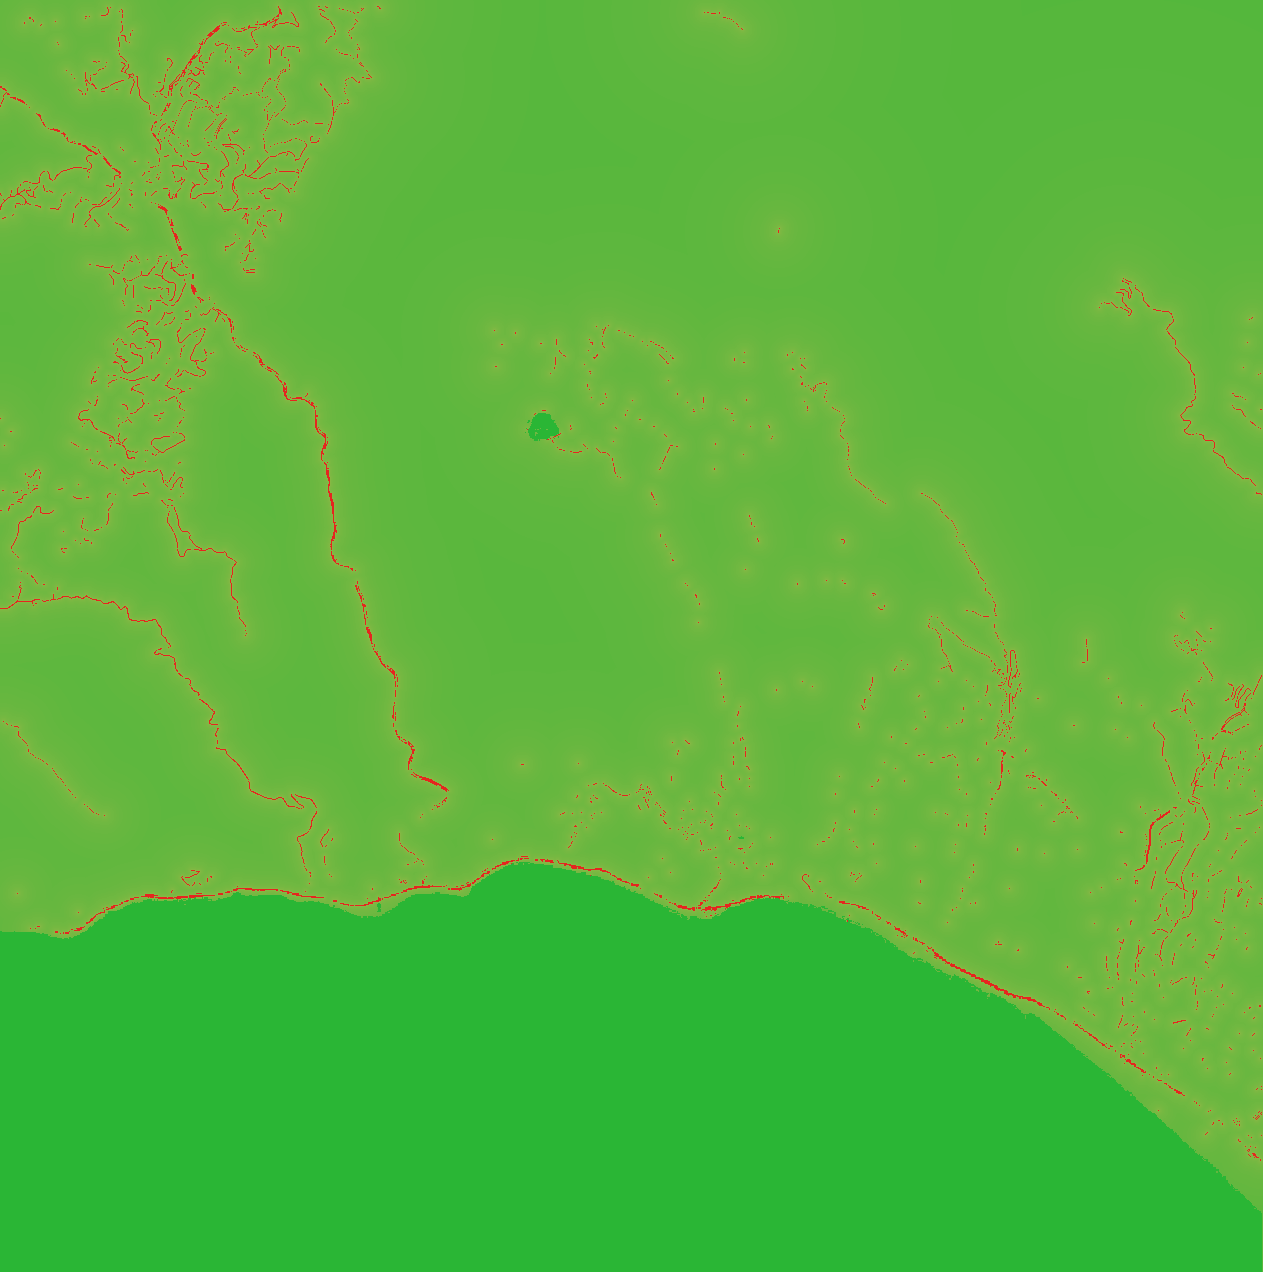
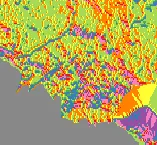
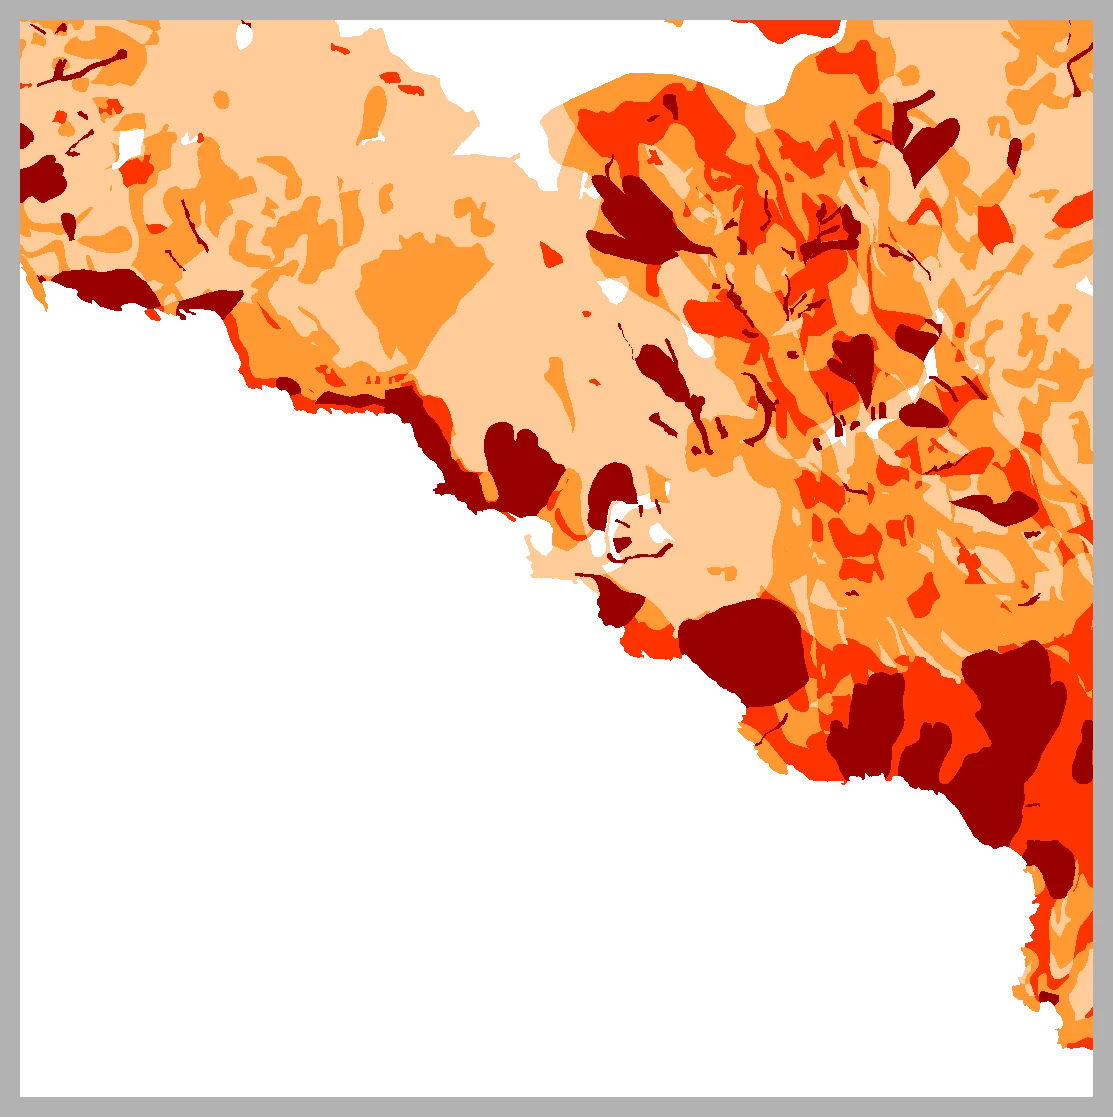
Soil Erosion Risk (RUSLE)
Estimated soil loss in tonnes per hectare per year (t/ha/yr) computed using the RUSLE equation (Revised Universal Soil Loss Equation). Combines rainfall erosivity (CHIRPS), soil erodibility (OpenLandMap), slope length and steepness (SRTM + MERIT Hydro), and vegetation cover (Sentinel-2 NDVI). Resolution 30m.
1.50 credits/per_km2soil_erosion_risk_rusle
Documentation
Maps
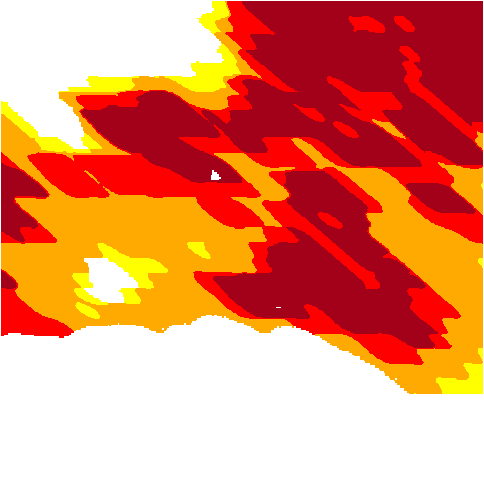
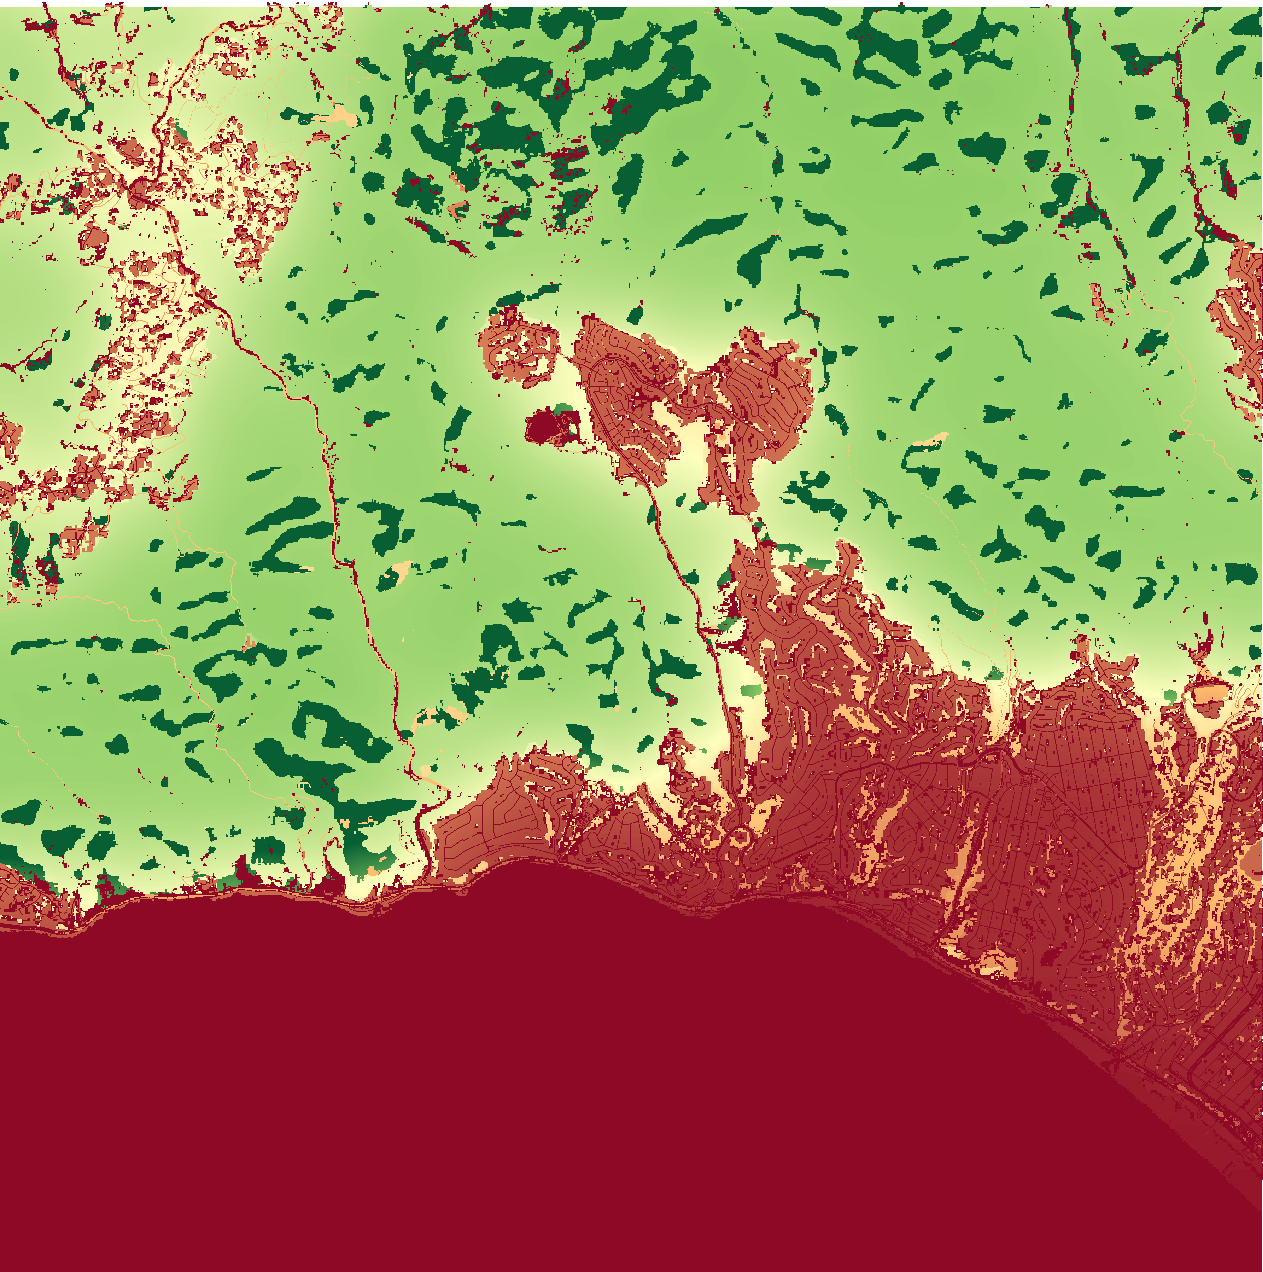
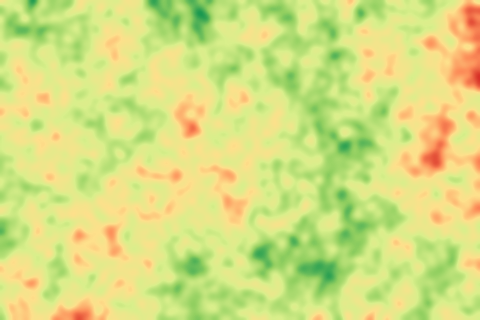
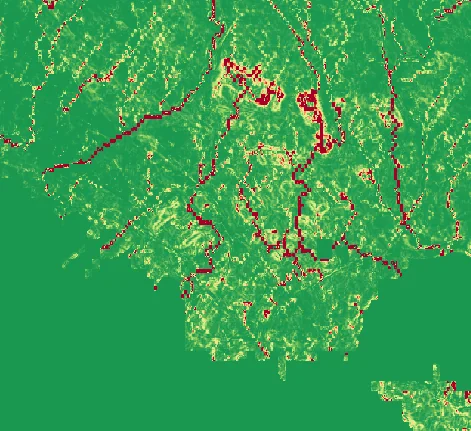
Wildfire Risk
Structural wildfire susceptibility (0-1) computed as weighted overlay of vegetation type (ESA WorldCover), summer NDVI (Sentinel-2), aridity index, and summer LST (Landsat 8/9). Mediterranean Italy AHP approach.
1.50 credits/per_km2fire_risk_map
Documentation
Maps
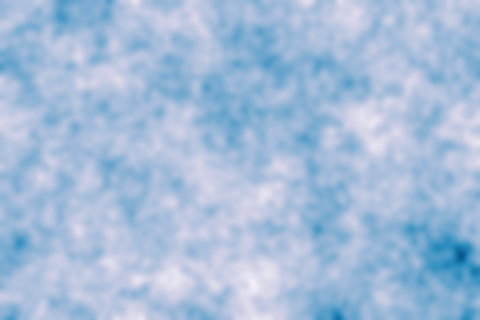
Noise Pollution
Noise pollution exposure index (0-1) computed as weighted overlay of distance to major roads (OSM), railways (OSM), airports (OSM), urban built-up density (GHSL), and industrial/commercial land (OSM). Global proxy approach, compatible with EU END directive.
1.50 credits/per_km2noise_pollution_map
Documentation
Maps
Geological Map of Greece
Geological Map of Greece (EAGME 500K) — 91 lithological-stratigraphic units from the Hellenic Survey of Geology and Mineral Exploration
2.00 credits/geological_map_gr
Documentation
Maps
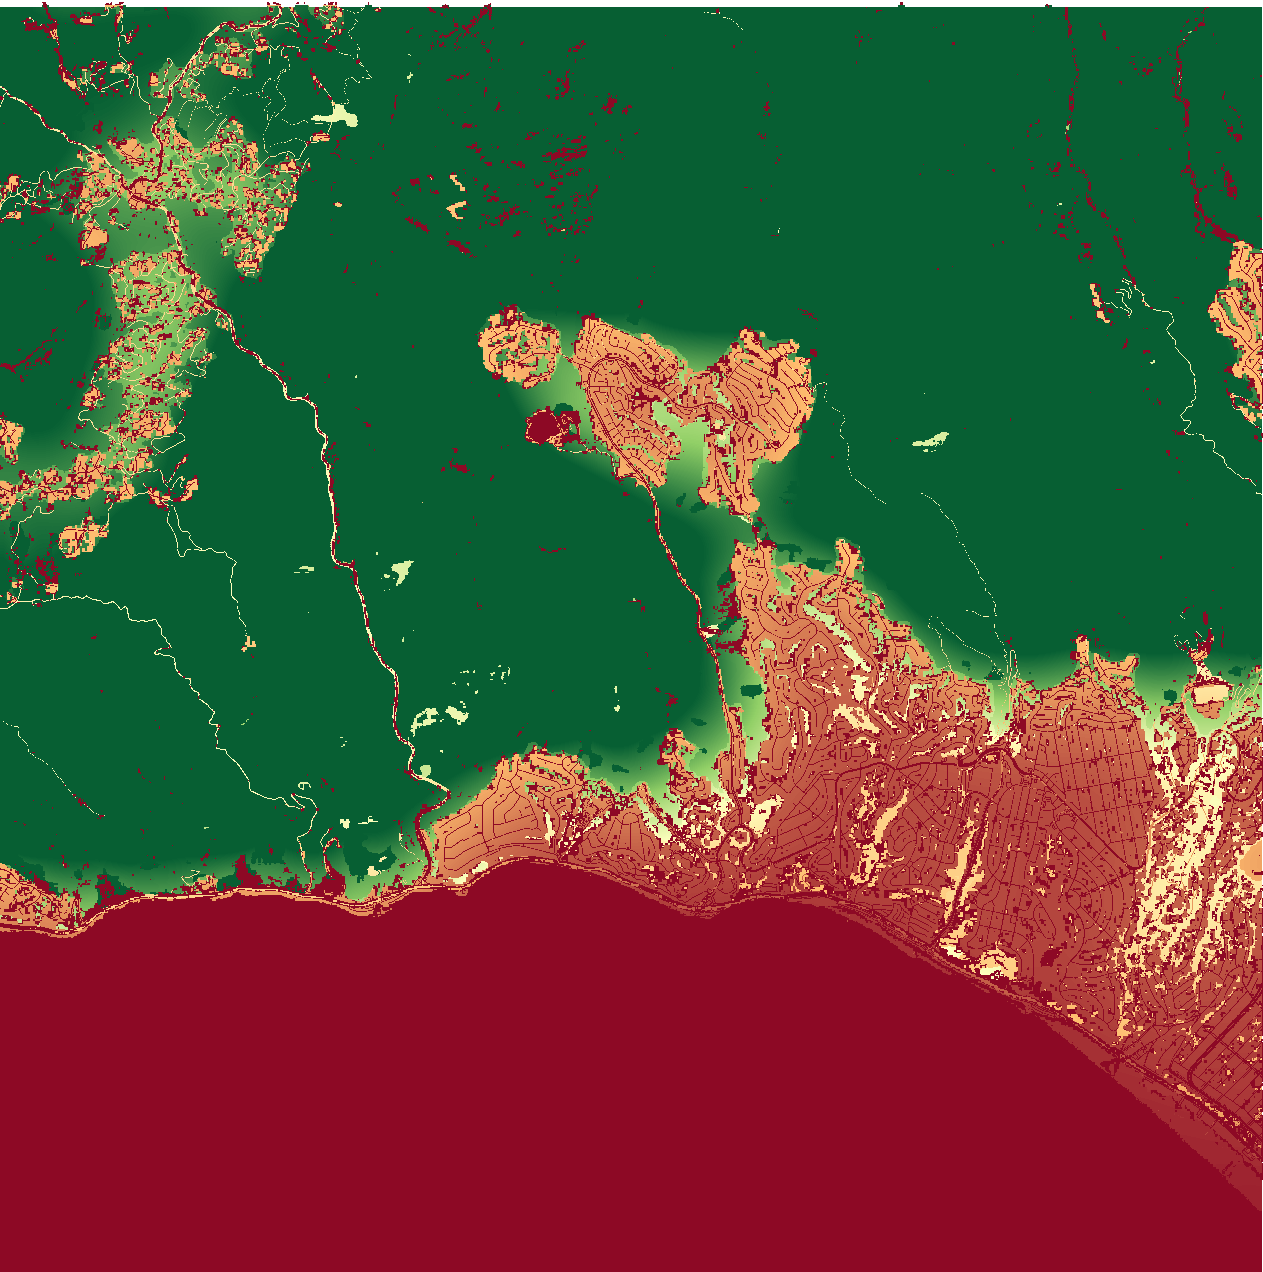
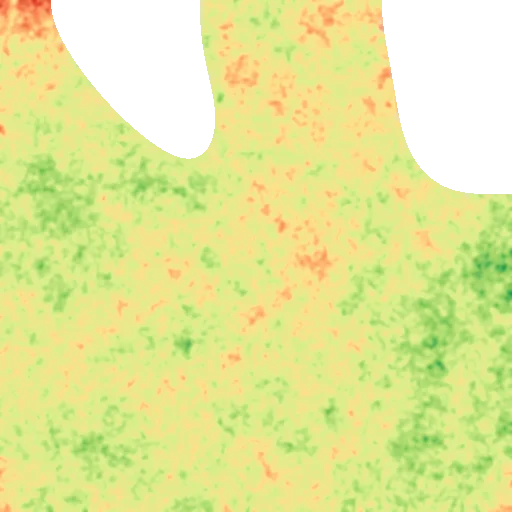
Surface Runoff Risk
Composite surface runoff risk index (0-1) combining flow accumulation (MERIT Hydro), impervious surfaces (Copernicus 30m) and inverted terrain slope (NASA SRTM 30m). High values mark flat impervious areas where rainwater concentrates and cannot infiltrate.
0.50 credits/per_km2surface_runoff_risk
Documentation
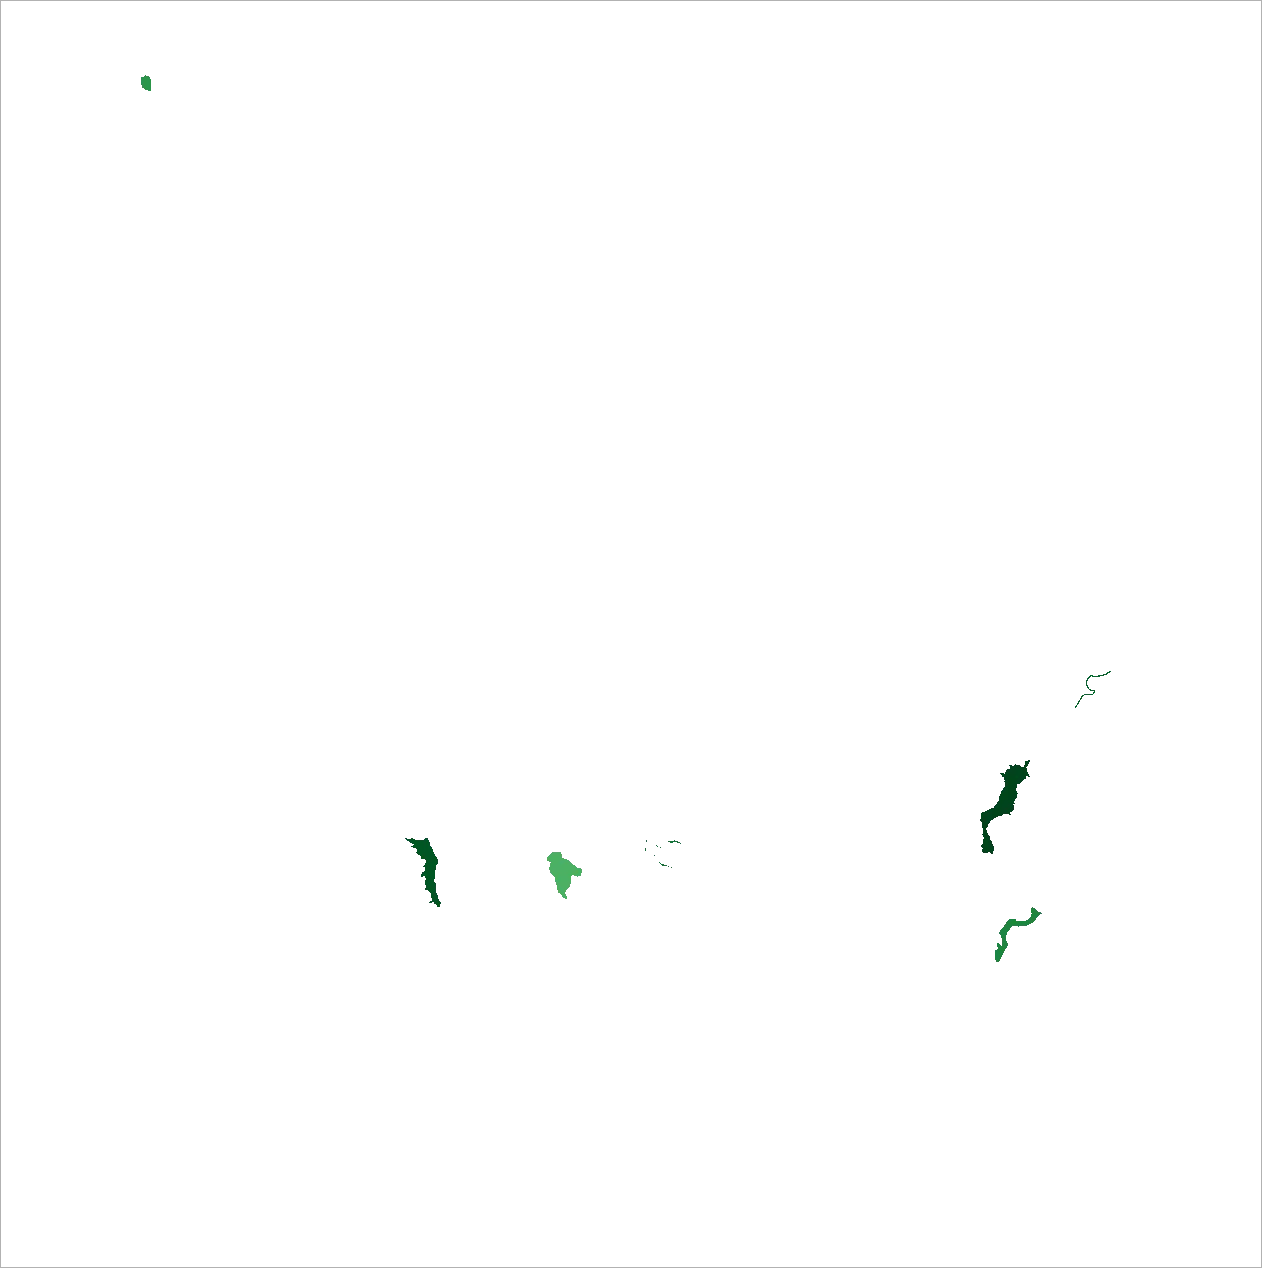
Maps
Forest Height Change (2000-2024)
Change in forest canopy height at 30m resolution. Shows tree growth (gain) and height loss (logging, storms). 2000-2024 extended variant, derived from Hansen GFC v1.12 and ETH Global Canopy Height 2020 (approximation of the GLCLUC 7-class scheme).
2.00 credits/per_km2forest_height_change_extended
Documentation
kpi-documentation.macro.biodiversity
ESG Report Evaluation
AI evaluation of an ESG report PDF against industry benchmarks
5.00 credits/flatesg_report_evaluation
kpi-documentation.macro.biodiversity
Report HTML Render
Render a saved report as HTML via the report-generator service
1.00 credits/flatreport_generator_render_html
kpi-documentation.macro.biodiversity
Report AI Field
Generate a single AI-written field for a report template
1.00 credits/flatreport_generator_generate_ai
kpi-documentation.macro.biodiversity
Report PDF Import
Import an existing PDF into the report-generator pipeline
2.00 credits/flatreport_generator_import_pdf
Maps
Geological Map of Italy
Geological Map of Italy — INSPIRE-harmonised 1:100K geological vector data published by ISPRA Servizio Geologico d'Italia (CC-BY 4.0). 8,934 dissolved lithostratigraphic units covering mainland, Sicily and Sardinia.
2.00 credits/geological_map_it
Documentation
Maps
Geological Map of Spain
Geological Map of Spain — IGME-CSIC OneGeology 1:1M geological vector data (CC-BY 4.0). 16,041 lithostratigraphic units covering the Iberian peninsula, Balearic and Canary Islands.
2.00 credits/geological_map_es
Documentation
Maps
Landslide Hazard (PAI)
ISPRA national mosaic (2020-2021) of landslide hazard zones from the Hydrogeological Setting Plans (PAI), harmonised into 5 classes: attention areas AA and hazard from moderate P1 to very high P4. Source: IdroGEO platform (CC BY-SA 4.0).
2.00 credits/landslide_hazard_it
Documentation
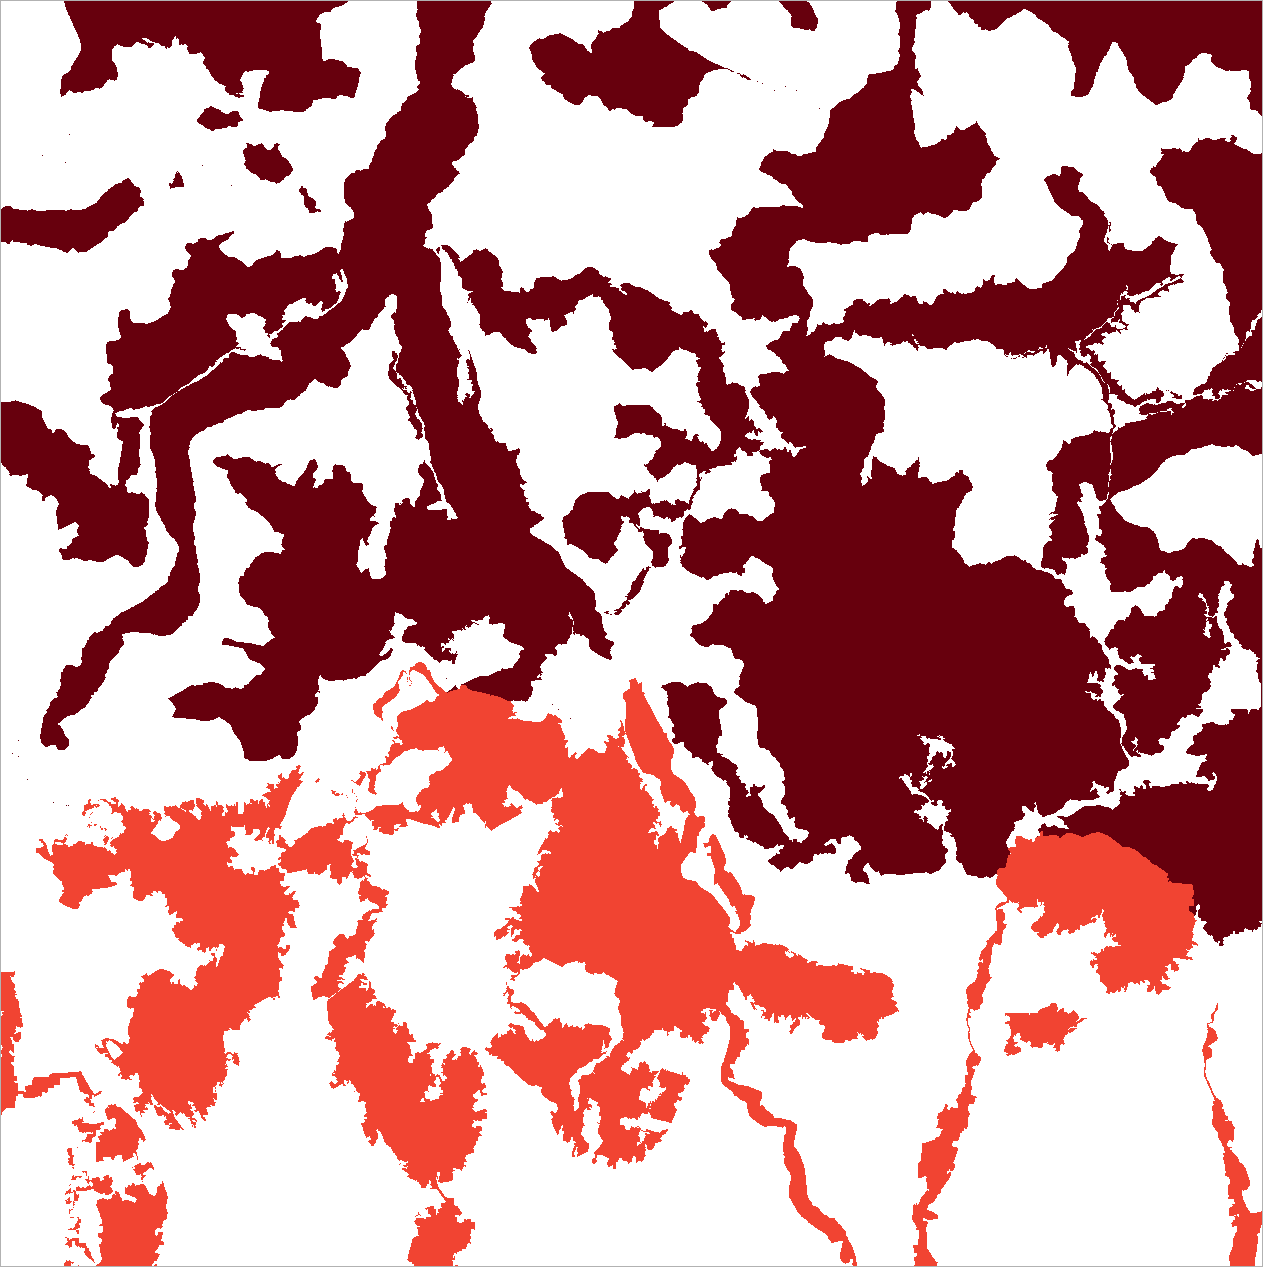
Maps
Flood Hazard
ISPRA national mosaic (2020) of hydraulic (flood) hazard zones for the 3 scenarios of Legislative Decree 49/2010 (Floods Directive 2007/60/EC): P1 low, P2 medium, P3 high probability. Source: IdroGEO platform (CC BY-SA 4.0).
2.00 credits/flood_hazard_it
Documentation
Maps
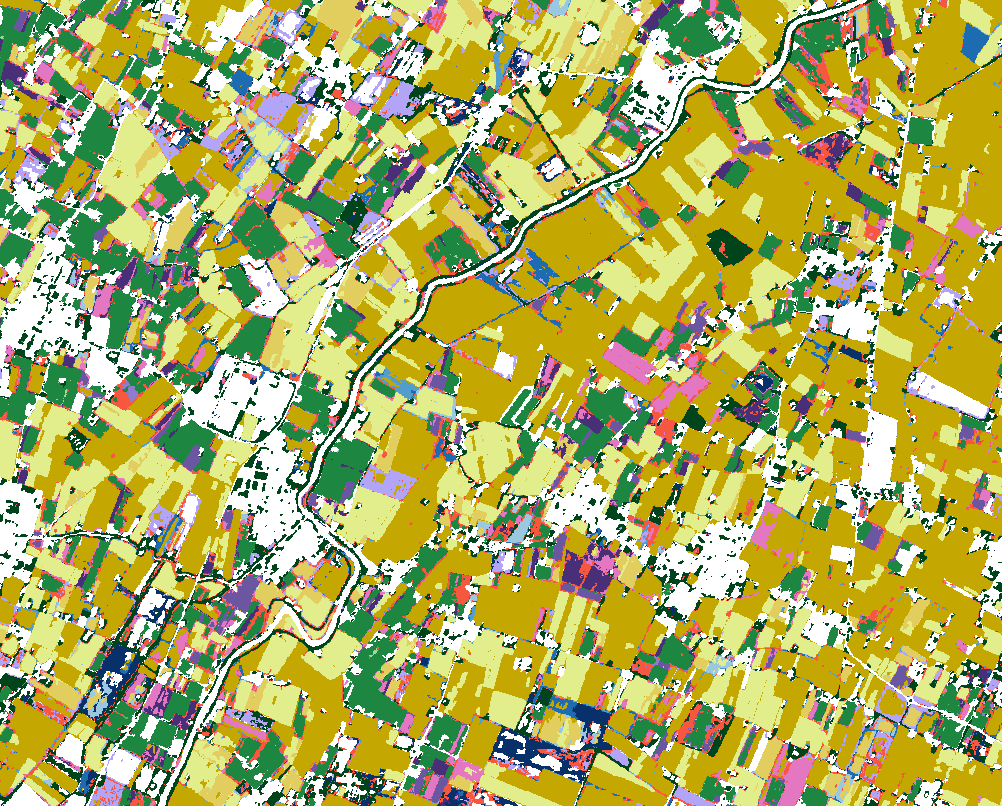
Agricultural Land Use Systems
Harmonised Europe-wide map of agricultural land use systems (ESDAC/JRC), derived by integrating the Copernicus High Resolution Layers on grassland and cropland (2017-2021). Classifies EEA38 agricultural land into level-2 classes: permanent grassland, permanent crops, arable systems, ley cropping systems, land use change, inconsistencies and data gaps. 10 m resolution. Source: ESDAC/JRC, European Commission (Fahl et al. 2026).
0.20 credits/per_km2eu_agri_land_use
Documentation