Back to KPI list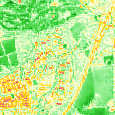 NDMI - Vegetation Moisture
 NDMI - Vegetation Moisture
 NDMI - Vegetation Moisture
 NDMI - Vegetation Moisture
NDMI - Vegetation Moisture
Land Usev00.80 credits/per_km2
Responsible:Niccolò Calandri
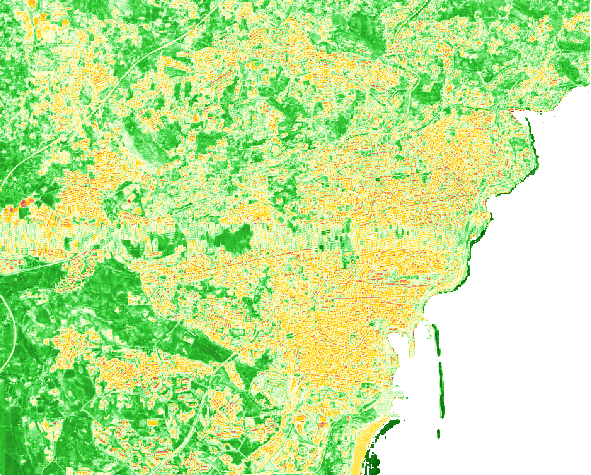
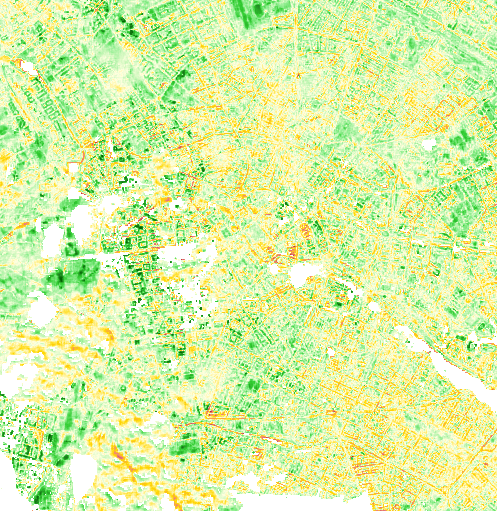
Layer NDMI - Vegetation Moisture on real sites
Real Estate UK
Catania
Berlino Quarter
Mina el Cerrejon
NDMI - Vegetation Moisture
Overview
The Normalized Difference Moisture Index (NDMI) is a spectral index derived from Sentinel-2 satellite imagery that measures the water content in the vegetation canopy. Values range from −1 to +1, where higher values indicate greater foliar moisture and favourable water conditions, while low or negative values signal water stress or the absence of vegetation.
NDMI exploits the sensitivity of the SWIR band (Short-Wave Infrared, ~1610 nm) to liquid water in leaf tissues: water absorbs strongly at 1610 nm, while NIR (~842 nm) is primarily influenced by leaf cell structure. The ratio between the two bands isolates the water signal from the structural response of vegetation (Gao, 1996).
The platform displays NDMI in three complementary views: a trend line chart showing monthly variation of foliar moisture, a circle gauge comparing the site (ROI) with the control area (CA), and map layers showing the spatial distribution of moisture at pixel level — in standard, annual range, and inter-period delta modes.
Calculation Methodology
NDMI is computed from ESA Sentinel-2 Level-2A surface reflectance imagery (10–20 m native resolution):
where NIR = Band 8 (842 nm, 10 m) and SWIR = Band 11 (1610 nm, 20 m)
For each observation period, all cloud-free Sentinel-2 images are composited into a pixel-wise median. The resulting NDMI values are spatially aggregated (min, max, mean) over the site polygon (ROI) and the control area (CA). Data are sourced from the ESA Sentinel-2 L2A archive (Copernicus) at 10 m resolution (Band 8), available from March 2017 onward.
What You See on the Platform
Assessment > Land Use > "NDMI - Vegetation Moisture" (Line Chart)
Line Chart. A monthly time series chart displaying NDMI values for the site (ROI) and, optionally, the control area (CA).
Purpose: To show how vegetation moisture evolves across months, revealing seasonal patterns of water stress and favourable hydration periods.
Description: The X-axis shows months (Jan–Nov or the full selected period). The Y-axis spans from −1 to +1 with step intervals of 0.25. Each monthly data point is drawn as a coloured dot whose colour reflects its NDMI value using the 11-colour moisture gradient (dark red = severe water stress; dark green = high moisture). The solid line connects all site dots. A dashed grey line shows the control area (CA) when the CA toggle is active. Below the chart, three statistics are displayed: Min, Med (mean), and Max of the monthly values over the period.
How it's calculated: For each month, all cloud-free Sentinel-2 pixels within the site polygon are processed using the NDMI formula. The resulting pixel-wise mean is spatially aggregated to produce the monthly ROI and CA values shown on the chart.
Legend: Dot colour follows the continuous NDMI gradient:
| Range | Colors | Moisture condition |
|---|---|---|
| −1.0 to −0.3 | ■ #8B0000 → ■ #F08080 | Severe to moderate water stress, bare soil |
| −0.3 to 0.0 | ■ #F08080 → ■ #FFD700 | Low moisture, vegetation with water deficit |
| 0.0 to 0.2 | ■ #FFD700 → ■ #FFFFE0 | Transition, moderate moisture |
| 0.2 to 0.4 | ■ #FFFFE0 → ■ #90EE90 | Good moisture |
| 0.4 to 1.0 | ■ #90EE90 → ■ #004d00 | High to very high moisture content |
Interpretation example:
If the chart shows a summer dip to −0.15 (gold/light dot) and a spring peak of 0.45 (dark green dot), the site experiences moderate seasonal moisture stress typical of temperate vegetation with summer drought — a pattern that may indicate elevated wildfire risk in dry months.
Assessment > Land Use > "NDMI" (Gauge)
Gauge. A semicircular dual-arc gauge comparing the annual mean NDMI of the site (ROI) against the control area (CA).
Purpose: To summarise in a single visual whether the site's vegetation moisture is better or worse than the surrounding landscape.
Description: The gauge shows two concentric arcs: the outer arc represents the site (ROI) mean NDMI and the inner arc represents the control area (CA) mean NDMI. Both arcs are coloured according to the A–E quality scale. The centre displays the ROI value and the CA value, plus a delta badge showing the difference (ROI − CA). A positive delta (green badge) means the site has better moisture conditions than its surroundings; a negative delta (red badge) means the opposite.
0.35NDMI
How it's calculated: The annual mean NDMI is computed from all monthly pixel-wise composites within the selected period. The quality grade is assigned based on the following thresholds:
Legend:
| Level | NDMI Range | Color | Meaning |
|---|---|---|---|
| A | 0.4 – 1.0 | ■ #00A67A | High moisture, vigorous and well-hydrated vegetation |
| B | 0.2 – 0.4 | ■ #00DF80 | Good moisture, vegetation in favourable hydric conditions |
| C | 0.0 – 0.2 | ■ #FFD21E | Moderate moisture, acceptable hydric conditions |
| D | −0.3 – 0.0 | ■ #FF8B16 | Low moisture, vegetation with water deficit |
| E | −1.0 – −0.3 | ■ #FF367F | Severe water stress, bare soil or extremely dry vegetation |
Interpretation example:
If the gauge shows ROI = 0.35 (grade B) and CA = 0.12 (grade C), the site maintains better moisture conditions than its surrounding landscape — a positive ecological signal suggesting the site supports healthier, less stressed vegetation than the regional context.
Assessment > Land Use > "NDMI" (Assessment Sidebar Row)
Assessment Sidebar Row. A single row in the Land Use KPI panel within the Assessment sidebar, showing the current NDMI grade.
Purpose: To provide a quick A–E quality rating for NDMI as part of the broader land use assessment alongside other vegetation indices.
Description: The row shows the label "NDMI", the latest numeric value, and a coloured grade badge (A–E). Clicking the row navigates to the full NDMI section.
How it's calculated: The latest value from the time series (ROI data) is extracted and graded using the same breakpoints as the gauge (E below −0.3, D from −0.3 to 0, C from 0 to 0.2, B from 0.2 to 0.4, A from 0.4 to 1).
Interpretation example:
If the sidebar shows an orange "D" badge next to NDMI 0.05, the site's vegetation is experiencing water deficit conditions — consistent with summer drought stress or low-density vegetation on dry substrates.
Maps > Land Use > "NDMI" (Map Layer)
Map Layer. An interactive satellite map layer displaying NDMI values at pixel level across the site and its surroundings.
Purpose: To show the spatial distribution of vegetation moisture, identifying which parts of the site are most and least hydrated.
Description: Each pixel is coloured according to its NDMI value using the continuous 11-colour moisture gradient. Dark red pixels indicate severely stressed or bare areas. Dark green pixels indicate dense, well-hydrated vegetation. The site boundary polygon is overlaid. Users can switch between three sub-layers via the generation mode selector: standard NDMI (single period), NDMI range (annual mean), and NDMI range delta (change between two periods). A colour bar legend with min/max labels is shown in the layer panel.
How it's calculated: The map tile is generated from the Sentinel-2 pixel-wise median composite for the selected period. Each pixel's NDMI value is mapped to a colour from the 11-step gradient (vmin = −1, vmax = +1).
NDMI Scale
-1+1Severe water stressVery high moisture
Legend: Continuous gradient from ■ #8B0000 (NDMI = −1, extreme stress) to ■ #004d00 (NDMI = +1, very high moisture):
| Range | Colors | Moisture condition |
|---|---|---|
| −1.0 to −0.3 | ■ #8B0000 → ■ #F08080 | Severe to moderate water stress, bare soil |
| −0.3 to 0.0 | ■ #F08080 → ■ #FFD700 | Low moisture, vegetation with water deficit |
| 0.0 to 0.2 | ■ #FFD700 → ■ #FFFFE0 | Transition, moderate moisture |
| 0.2 to 0.4 | ■ #FFFFE0 → ■ #90EE90 | Good moisture |
| 0.4 to 1.0 | ■ #90EE90 → ■ #004d00 | High to very high moisture content |
Interpretation example:
If the map shows a dark green interior (NDMI 0.45–0.60) with gold patches along woodland edges, the site has a well-hydrated forest core surrounded by transitional vegetation that is more exposed to moisture stress — a pattern typical of shaded riparian woodland adjacent to open scrub.
Maps > Land Use > "NDMI (range)" (Map Layer)
Map Layer. A map layer showing the mean NDMI over a configurable annual period, providing a more stable view of moisture conditions than a single-month snapshot.
Purpose: To represent the site's moisture state over an extended window, reducing the influence of short-term weather events and cloud-cover gaps.
Description: Same 11-colour gradient as the standard NDMI layer. The time window is defined in site settings and the map tooltip shows the average NDMI in the selected period. The layer captures seasonal moisture variation when a full annual window is used.
How it's calculated: All cloud-free Sentinel-2 images within the configured period are composited into a pixel-wise mean NDMI. The formula applied per image is the standard NDMI formula; the composite uses the median across all valid scenes.
Legend: Same 11-colour continuous gradient as the standard NDMI layer (■ #8B0000 to ■ #004d00).
Interpretation example:
An annual range layer showing mean NDMI of 0.30 across most of the site indicates consistently good foliar moisture throughout the year — a more robust signal than a single summer reading that may reflect a particularly dry or wet month.
Maps > Land Use > "NDMI (delta)" (Map Layer)
Map Layer. A map layer showing the pixel-wise difference in mean NDMI between two annual periods, indicating whether vegetation moisture has increased, decreased, or remained stable.
Purpose: To identify where moisture conditions have improved or deteriorated between two comparable periods, supporting trend monitoring and risk assessment.
Description: Pixels are coloured using a 9-colour diverging gradient: red tones indicate a decrease in moisture (increased stress), near-white indicates no change, and green tones indicate increased moisture.
How it's calculated: Delta is computed pixel-wise as: Mean NDMI (period 2) − Mean NDMI (period 1). Positive values indicate improved moisture conditions; negative values indicate degradation.
Legend: Diverging gradient from ■ #8B0000 (strong moisture decrease) through ■ #FFFAF0 (no change) to ■ #006400 (strong moisture increase):
| Colors | Trend |
|---|---|
■ #8B0000 → ■ #FFA07A | Moisture loss (increased stress) |
■ #FFFAF0 | No significant change |
■ #90EE90 → ■ #006400 | Moisture gain (improved hydration) |
Interpretation example:
If a large green patch appears on the delta layer over an area that showed drought stress in the previous year, the site has recovered from water deficit — possibly due to wetter weather, restored vegetation, or changed land management.
Data Sources
| Source | Provider | Coverage | Resolution | Period |
|---|---|---|---|---|
| ESA Sentinel-2 L2A (Copernicus) | ESA / Copernicus | Global | 10 m (B8), 20 m (B11) | 2017-03-28 — present |
Detailed Methodology
The processing pipeline for NDMI follows these steps:
- Image acquisition — All Sentinel-2 L2A images from the Copernicus collection within the requested date range and site area are retrieved
- Cloud masking — Pixels flagged by the Scene Classification Layer (SCL) as clouds, cloud shadows, snow, and ice are excluded
- Water masking — Water surfaces are excluded from the composite
- Per-image NDMI calculation — Per-pixel normalized difference of Band 8 (NIR, 842 nm) and Band 11 (SWIR, 1610 nm)
- Temporal compositing — Pixel-wise median across all valid observations in the period maximises spatial coverage and reduces noise
- Spatial aggregation — Min, max, and mean statistics are computed over the site (ROI) and the control area (CA)
Band 11 (20 m native resolution) is resampled to 10 m for alignment with Band 8. This introduces slight spatial interpolation that may affect edge pixels.
Related KPI variants also available on the platform:
- NDMI Range — mean NDMI over a selected annual period (pixel-wise); captures seasonal water content
- NDMI Range Delta — pixel-wise difference in mean NDMI between two periods; identifies moisture trend changes
Technical Notes
- NDMI map layers must be generated from Sentinel-2 imagery before KPI values can be computed; generation is triggered manually or on schedule from site settings
- Band 11 (20 m native resolution) is resampled to 10 m for alignment with Band 8; this introduces slight spatial interpolation that may affect edge pixels
- In areas with persistent snow or glaciers, the SCL cloud mask can produce artefacts — verify the temporal coverage of composites in alpine sites
- NDMI measures foliar water content but does not distinguish between free water and water bound to leaf tissues; interpretation should consider vegetation type and phenology
- For temporal comparisons, use equivalent seasonal windows to avoid confounding climate seasonality with genuine moisture trend changes
- The index is sensitive to residual atmospheric effects and soil moisture in sparsely vegetated areas; results in bare or very low-density vegetation zones may reflect soil conditions rather than plant water status
- Data availability begins from March 2017 (Sentinel-2 L2A archive start); sites requiring pre-2017 analysis cannot be served by this KPI
- Related KPIs: NDVI (vegetation density and health), NDWI (surface and canopy water content), LST (land surface temperature — thermal stress proxy), and Land Use (habitat context)
Bibliography
- Gao, B.C. (1996). "NDWI — A normalized difference water index for remote sensing of vegetation liquid water from space". Remote Sensing of Environment, 58(3), 257–266. DOI: 10.1016/S0034-4257(96)00067-3
- Wilson, E.H. & Sader, S.A. (2002). "Detection of forest harvest type using multiple dates of Landsat TM imagery". Remote Sensing of Environment, 80(3), 385–396. DOI: 10.1016/S0034-4257(01)00318-2
- Ceccato, P. et al. (2001). "Detecting vegetation leaf water content using reflectance in the optical domain". Remote Sensing of Environment, 77(1), 22–33. DOI: 10.1016/S0034-4257(01)00191-2
- Delegido, J. et al. (2011). "Evaluation of Sentinel-2 Red-Edge Bands for Empirical Estimation of Green LAI and Chlorophyll Content". Sensors, 11(7), 7063–7081. DOI: 10.3390/s110707063
- ESA Copernicus. (2021). Sentinel-2 User Handbook. European Space Agency. ESA Sentinel-2