Back to KPI list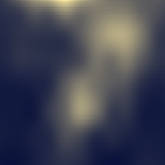 Light Pollution
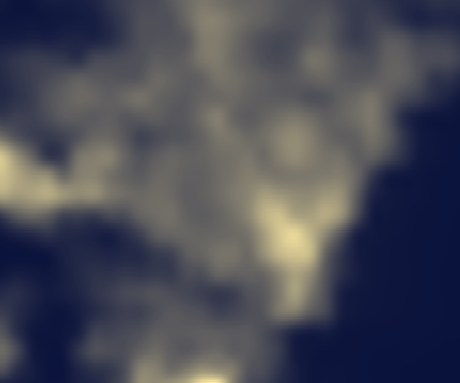 Light Pollution
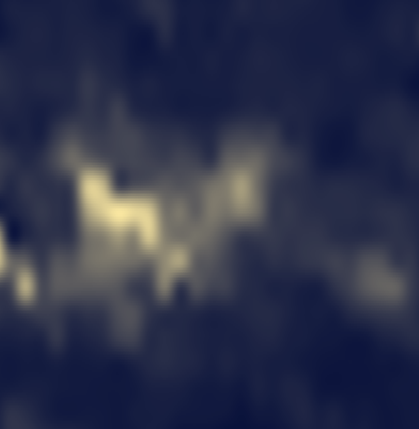 Light Pollution
 Light Pollution
Light Pollution
Risksv03.00 credits/per_km2
Responsible:Niccolò Calandri
Layer Light Pollution on real sites
Real Estate UK
Catania
Berlino Quarter
Mina el Cerrejon
Light Pollution
Overview
Light pollution measures the intensity of artificial night light emitted by roads, buildings, signs and other anthropic elements, expressed in nanowatts per square centimetre per steradian (nW/cm2/sr). It represents one of the primary stressors for natural ecosystems: artificial night light disrupts the circadian rhythms of animals and plants, interferes with insect navigation (particularly nocturnal Lepidoptera), disturbs the reproduction of migratory birds, and alters plant phenology.
Ecosystems exposed to high levels of artificial night light exhibit reduced nocturnal biodiversity, altered food webs, and impoverishment of night-related ecosystem services (nocturnal pollination, predation, decomposition).
Calculation Methodology
The calculation uses the VIIRS Day/Night Band Monthly dataset (NOAA/NASA) at 500 m native resolution, which captures the spectral radiance of the Day/Night Band (DNB) of the VIIRS sensor aboard the Suomi NPP satellite.
The calculation process involves the following steps:
- Image collection -- monthly VIIRS DNB cloud-free composites (VCMCFG product) are filtered by date range and area of interest on Google Earth Engine
- Bicubic smoothing -- each monthly image is resampled using bicubic interpolation and reprojected at 30 m output scale
- Temporal compositing -- pixel-wise mean of all monthly images in the selected period
- Spatial aggregation -- min, max, and mean radiance values are computed over the site (ROI) and control area (CA) polygons
- Large area handling -- areas larger than 25 x 25 km are split into quadrants, processed in parallel, and merged
Unit: nanowatts per square centimetre per steradian (nW/cm2/sr)
Visualisation: colour gradient from dark blue (low pollution) to yellow (high pollution)
Data Sources
| Source | Provider | Coverage | Resolution | Period |
|---|---|---|---|---|
| VIIRS Day/Night Band Monthly (VCMCFG) | NOAA / NASA | Global | 500 m (native), 30 m (output) | April 2012 -- present |
What You See on the Platform
Assessment > Risks > "Light Pollution" (Gauge)
Gauge. A semicircular arc gauge (CaRoiChart) displaying the mean radiance for the site (ROI arc) and the control area (CA arc), with a delta badge comparing the two.
Purpose: To answer the question "How intense is artificial night light at this site compared to its control area?" and to contextualise the result against the A--E quality scale.
Description: The card is titled "Light Pollution" and carries the sub-topic badge "E2-4, AR 22 and AR 23b". The gauge shows two arcs: the outer arc represents the site (ROI) and the inner arc the control area (CA). The current mean radiance in nW/cm2/sr is displayed at the centre of the gauge, along with a delta badge showing the difference between ROI and CA. Numeric rows below show the exact ROI and CA values against their respective benchmarks.
How it's calculated: The displayed value is the spatial mean of radiance (nW/cm2/sr) over the site polygon, derived from VIIRS DNB monthly composites processed with bicubic smoothing at 30 m output scale. The CA value is the same calculation applied to the control area polygon. The delta badge is ROI minus CA. The colour of each arc is determined by the quality level thresholds (A--E scale) provided by the API.
Note: This indicator is inverted -- lower values indicate better conditions. A lower ROI radiance relative to CA is a favourable signal.
Legend:
| Level | Radiance (nW/cm2/sr) | Color | Meaning |
|---|---|---|---|
| A | 0 -- 5 | ■ #00A67A | Near-natural dark sky; optimal for nocturnal fauna |
| B | 5 -- 30 | ■ #00DF80 | Low light pollution; rural areas with infrastructure |
| C | 30 -- 60 | ■ #FFD21E | Moderate light pollution; peri-urban areas |
| D | 60 -- 90 | ■ #FF8B16 | High light pollution; dense urban peripheries |
| E | > 90 | ■ #FF367F | Extreme light pollution; nocturnal fauna severely impaired |
Interpretation example:
If ROI shows 19.7 nW/cm2/sr (grade B, light green) and CA shows 59.6 nW/cm2/sr, the site has low light pollution while the control area is in the moderate range -- the site benefits from darker conditions that favour nocturnal biodiversity. If ROI shows 85 nW/cm2/sr (grade D, orange) and CA shows 45 nW/cm2/sr, the site is significantly more light-polluted than its surroundings, signalling disruption of nocturnal ecological processes.
Mappe > "Light Pollution" (Map Layer)
Map Layer. An interactive map overlay showing the intensity of artificial night light across the site and surroundings, rendered as a continuous colour gradient from dark blue to yellow.
Purpose: To provide a spatially resolved view of light pollution across the site, identifying hotspots and darker refuge zones.
Description: When the "Light Pollution" layer chip is selected in the map panel, the VIIRS-derived radiance raster is displayed over the base map. The legend panel shows the title with a continuous colour gradient bar. The layer selector also offers related variants: "Light Pollution annual range" and "Light Pollution range delta between years". If a layer has not yet been generated for the site, a generation button is shown instead.
How it's calculated: The raster is derived from VIIRS DNB monthly composites resampled with bicubic interpolation at 30 m output scale, then temporally averaged over the selected period. The colour scale normalises dynamically to the actual data range of each image -- there are no hardcoded minimum/maximum bounds.
Note: This indicator is inverted -- darker areas (dark blue on the colour gradient) represent better ecological conditions for nocturnal fauna than brighter areas (yellow).
Legend: The map uses a continuous linear colour gradient that auto-adjusts to the data range:
| Color | Radiance | Meaning |
|---|---|---|
■ #09123B (dark blue) | Lowest values | Near-natural darkness; minimal light pollution |
■ #F9E6A0 (yellow) | Highest values | Intense artificial light; high light pollution |
Interpretation example:
If the map shows a dark-blue zone over a forested area adjacent to a yellow zone over a commercial district, the spatial contrast illustrates how the forest provides a dark refuge for nocturnal species while the built-up area emits intense artificial light.
Panoramica > Highlights > "Light Pollution" (Highlights Card)
Highlights Card. A summary card in the Overview > Highlights section showing the light pollution status for the site.
Purpose: To give a quick overview of the site's light pollution level alongside other key environmental indicators.
Description: The card is labelled "Light Pollution" and displays the computed mean radiance metric for the site. A colour badge indicates the quality grade (A--E).
How it's calculated: Same spatial mean radiance calculation as the Assessment gauge, graded against the A--E quality thresholds.
Note: This indicator is inverted -- lower values indicate better conditions for nocturnal biodiversity.
Interpretation example:
A "Light Pollution" card showing a green badge (grade B) and 15 nW/cm2/sr indicates low artificial night light -- conditions that support healthy nocturnal fauna activity.
Panoramica > Highlights > "Light Pollution" (Highlights Table Row)
Highlights Table Row. A row in the KPI comparison table within the Highlights section, labelled "Light Pollution", showing the radiance value and grade for the site in the "Risk" category group.
Purpose: To provide a scannable comparison of the site's light pollution performance alongside other risk-category KPIs in a single table view.
Description: The row appears under the "Risk" section of the highlights table. It shows the KPI label "Light Pollution", the current grade badge (A--E), and the numeric value in nW/cm2/sr.
How it's calculated: Same as the Assessment gauge -- spatial mean radiance, graded A--E against the quality thresholds.
Note: This indicator is inverted -- a grade of E (pink/red) means the site has extreme artificial night light; a grade of A (green) means near-natural dark sky conditions.
Interpretation example:
If the "Light Pollution" row shows grade A (green) and 3.2 nW/cm2/sr, the site enjoys near-natural darkness -- optimal conditions for nocturnal fauna and astronomical observation.
Sites Progress > "Light Pollution (SITE/CONTROL)" (Sites Progress Column)
Sites Progress Column. A column in the multi-site comparison table at the Sites Progress view, showing both the site (ROI) and control area (CA) radiance values for each monitored site.
Purpose: To allow portfolio managers to compare light pollution levels across all monitored sites in a single table.
Description: The column header reads "Light Pollution (SITE/CONTROL)" with a tooltip "Light pollution level measured at the site." Each cell shows the site and control area radiance values as a dual badge. The column is filterable and sortable.
How it's calculated: Same spatial mean radiance calculation as the Assessment gauge, applied to each site's polygon and its associated control area polygon.
Note: This indicator is inverted -- lower radiance values indicate better ecological conditions for this column.
Interpretation example:
A cell showing 8 / 42 nW/cm2/sr (Site / Control) in green/yellow indicates the site is in a relatively dark area (grade B) while the control area has moderate light pollution (grade C) -- the site offers better nocturnal habitat conditions.
Multi-Year Trends > "Light Pollution" (Line Chart)
Line Chart. A time-series chart showing the evolution of light pollution radiance at the site across multiple years, accessible from the Multi-Year Trends section.
Purpose: To reveal whether the site's artificial night light is increasing, decreasing, or stable over time -- a direct indicator of urbanisation pressure and nocturnal ecosystem health.
Description: The trend type selector shows "Light Pollution" as one of the available trend types. The chart displays annual mean radiance values plotted over time (year on the X axis, nW/cm2/sr on the Y axis). The site and control area trends may be shown simultaneously.
How it's calculated: Each annual data point is the temporal mean of VIIRS DNB monthly composites for that year, processed using the same bicubic smoothing methodology. Data availability starts from April 2012.
Note: This indicator is inverted -- an upward trend in the chart represents worsening conditions (increasing artificial night light and nocturnal disruption).
Interpretation example:
If the chart shows radiance increasing from 12 nW/cm2/sr in 2015 to 28 nW/cm2/sr in 2025 at the site (from grade B to the upper boundary of B), this doubling over ten years signals growing light pollution pressure -- likely driven by local urban expansion or new infrastructure.
Bibliography
-
Falchi, F., Cinzano, P., Duriscoe, D., et al. (2016). "The new world atlas of artificial night sky brightness". Science Advances, 2(6), e1600377. DOI: 10.1126/sciadv.1600377
-
Gaston, K.J., Bennie, J., Davies, T.W., Hopkins, J. (2013). "The ecological impacts of nighttime light pollution: a mechanistic appraisal". Biological Reviews, 88(4), 912--927. DOI: 10.1111/brv.12036
-
Cinzano, P., Falchi, F., Elvidge, C.D. (2001). "The first world atlas of the artificial night sky brightness". Monthly Notices of the Royal Astronomical Society, 328(3), 689--707.
-
Elvidge, C.D., Baugh, K., Zhizhin, M., Hsu, F.C., Ghosh, T. (2017). "VIIRS night-time lights". International Journal of Remote Sensing, 38(21), 5860--5879. DOI: 10.1080/01431161.2017.1342050
Detailed Methodology
See the Calculation Methodology section for the core computation. Additional processing details are documented here for expert users.
Technical Notes
- VIIRS DNB values include light reflected from surfaces (snow, residual clouds), which may overestimate the signal in winter months or at high latitudes. Annual averages are recommended for reliable inter-annual comparisons.
- The VIIRS sensor replaced the DMSP/OLS series from 2012, providing improved radiometric sensitivity and spatial resolution. Data are available from April 2012 onward.
- Seasonal variability (snow cover, vegetation phenology) can influence monthly radiance values. For trend analysis, use annual means to smooth out seasonal fluctuations.
- In areas with gas flares (oil and gas installations), radiance values may be artificially elevated and do not reflect true light pollution for biodiversity purposes.
- The output resolution stored in the platform is 30 m, which is the bicubic smoothing scale applied to the native 500 m VIIRS data -- this enhances visual quality but does not add real spatial detail beyond the native sensor resolution.
- The quality thresholds (A--E) are [0, 5, 30, 60, 90, 120] nW/cm2/sr and are delivered to the platform via API. The indicator is inverted: lower radiance values correspond to better grades.
- Related KPIs: Fertilizer Pollution and Toxic Metals Soil Pollution are other risk-category KPIs that quantify different anthropogenic pressures on ecosystems.
- Data update frequency: monthly, as new VIIRS DNB composites become available from NOAA.