Back to KPI list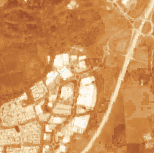 NDWI - Water Content
 NDWI - Water Content
 NDWI - Water Content
 NDWI - Water Content
NDWI - Water Content
Land Usev00.80 credits/per_km2
Responsible:Niccolò Calandri
Layer NDWI - Water Content on real sites
Real Estate UK
Catania
Berlino Quarter
Mina el Cerrejon
NDWI - Water Content
Overview
The Normalized Difference Water Index (NDWI) is a spectral satellite index that measures water content in landscapes. Derived from ESA Sentinel-2 imagery, values range from -1 to +1:
- Positive values indicate water bodies, wetlands, or strongly saturated surfaces
- Values around 0 indicate a transition zone with moderate soil moisture
- Negative values indicate dry surfaces, bare soil, built-up areas, or dry vegetation
NDWI is a versatile tool used for: water body mapping (lakes, rivers, ponds, wetlands), flood monitoring, water stress assessment, drought analysis, and irrigation management support. The index exploits the contrast between the Green band (560 nm), strongly reflected by water, and the NIR band (842 nm), absorbed by water but reflected by healthy vegetation. This suppresses the terrestrial vegetation signal and emphasises water characteristics.
The 3Bee platform implements NDWI following McFeeters (1996) using Sentinel-2 bands B3 (Green) and B8 (NIR). The platform shows NDWI in three complementary views: a trend line chart showing monthly variation, a circle gauge comparing site (ROI) with a control area (CA), and map layers showing spatial distribution at pixel level.
Calculation Methodology
NDWI is computed from ESA Sentinel-2 Level-2A surface reflectance imagery using the Green and NIR bands:
where Green = Band 3 (560 nm) and NIR = Band 8 (842 nm), both at 10 m native resolution
For each analysis period, all cloud-free Sentinel-2 images over the site area are collected. Cloud and shadow pixels are excluded. NDWI is calculated per pixel, then averaged across all valid observations to produce a temporal composite. Finally, spatial statistics (min, max, mean) are computed separately over the site (ROI) and the control area (CA).
Unlike NDVI, water masking is OFF by default — water bodies are the signal of interest and must not be excluded.
Data are sourced from ESA Sentinel-2 SR Harmonized at 10 m resolution (available from April 2017 onward). The analysis period is user-selectable.
What You See on the Platform
Assessment > Land Use > "NDWI - Water Content" (Line Chart)
Line Chart. A monthly time series chart displaying NDWI values for the site (ROI) and, optionally, the control area (CA).
Purpose: To show how water content in the landscape evolves across months, revealing seasonal patterns, water stress periods, and changes in surface water bodies over time.
Description: The X-axis shows months over the selected period. The Y-axis shows NDWI values from -1 to +1. Each monthly data point is drawn as a colored dot whose color reflects its NDWI value using the 11-color brown-to-blue gradient (brown = dry; white = transition; blue = wet/water). The solid line connects all site dots. A dashed grey line shows the control area (CA) values when the CA toggle is active. Below the chart, three statistics are shown: Min, Med (median of monthly values), and Max.
NDWI Scale
-1+1Very dry / built-upOpen water
How it's calculated: For each month, all cloud-free Sentinel-2 pixels within the site polygon are averaged pixel-wise. The resulting value is the monthly mean NDWI for the ROI and for the CA when toggled.
Legend: Dot color follows the continuous NDWI gradient:
| NDWI | Color | Represents |
|---|---|---|
| -1.0 | ■ #8B4513 | Very dry / built-up |
| -0.8 | ■ #CD853F | Dry |
| -0.6 | ■ #DEB887 | Low moisture |
| -0.4 | ■ #F5DEB3 | Below average |
| 0.0 | ■ #FFFAF0 | Neutral / transition |
| +0.2 | ■ #B0E0E6 | Light moisture |
| +0.4 | ■ #87CEEB | Moderate moisture |
| +0.6 | ■ #4682B4 | Wet vegetation |
| +0.8 | ■ #1E90FF | High water content |
| +1.0 | ■ #00008B | Open water |
Interpretation example:
If the chart shows summer values between -0.15 and -0.05 (white/light-brown dots) and a spike to 0.28 (powder blue) after an autumn rain event, the site has a normally dry surface that temporarily retains moisture after precipitation — characteristic of permeable grassland or dry-climate woodland with brief wet episodes.
Assessment > Land Use > "NDWI" (Gauge)
Gauge. A semicircular dual-arc gauge comparing the annual mean NDWI of the site (ROI) against the control area (CA).
Purpose: To summarise in a single visual comparison whether the site has more or less water content than its surrounding control area, and to assign it an A-E quality grade.
Description: The gauge shows two concentric arcs: the outer arc represents the site (ROI) mean NDWI and the inner arc represents the control area (CA) mean NDWI. Both arcs are coloured according to the A-E quality scale. The center displays the ROI value and the CA value, plus a delta badge showing the difference (ROI - CA). A positive delta (blue badge) means the site holds more water than its surroundings; a negative delta (brown/red badge) means the opposite.
0.22NDWI
How it's calculated: The annual mean NDWI is computed from all monthly pixel-wise means within the selected period. The quality grade is assigned based on:
Legend:
| Level | NDWI Range | Color | Meaning |
|---|---|---|---|
| A | > 0.3 | ■ #00A67A | Open water — lakes, rivers, inundated zones |
| B | 0.1 to 0.3 | ■ #00DF80 | Wetlands, marshy areas, partially flooded |
| C | -0.1 to 0.1 | ■ #FFD21E | Moderate moisture, transition zone |
| D | -0.3 to -0.1 | ■ #FF8B16 | Dry — sparse or dry vegetation, low soil moisture |
| E | < -0.3 | ■ #FF367F | Very dry — bare soil, artificial surfaces, arid vegetation |
Interpretation example:
If the gauge shows ROI = 0.22 (grade B) and CA = -0.05 (grade C), the site retains significantly more moisture than its surrounding landscape — a positive signal consistent with a riparian zone, irrigated area, or wetland habitat embedded in drier surroundings.
Assessment > Land Use > "NDWI" (Assessment Sidebar Row)
Assessment Sidebar Row. A single row in the Land Use KPI panel within the Assessment sidebar, showing the current NDWI quality grade.
Purpose: To provide a quick A-E quality rating for NDWI as part of the broader land use assessment overview.
Description: The row shows the KPI category label "NDWI", the latest numeric value, and a colored grade badge (A-E). Clicking the row navigates to the full NDWI section.
How it's calculated: The grade is assigned using the same thresholds as the gauge above.
Interpretation example:
If the sidebar shows a yellow "C" badge next to NDWI -0.04, the site is in the transition zone between dry land and wet area — typical of seasonally moist grassland or a site with moderate irrigation.
Maps > Land Use > "NDWI" (Map Layer)
Map Layer. An interactive satellite map layer displaying NDWI values at pixel level across the site and surroundings.
Purpose: To show the spatial distribution of water content, identifying which parts of the site are wet, dry, or contain open water bodies.
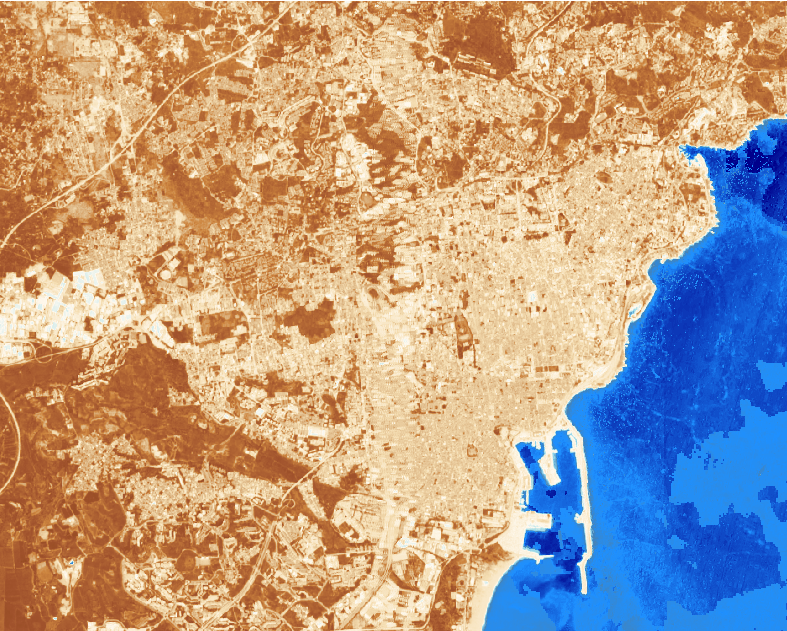
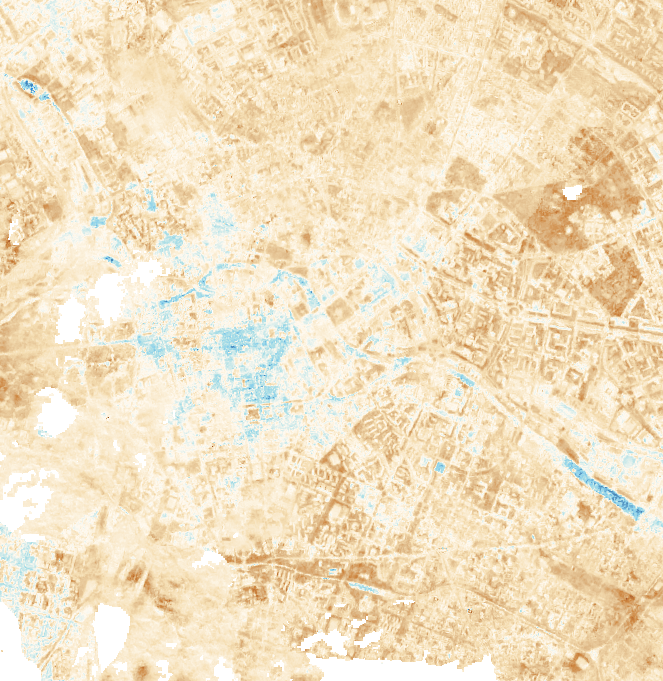
Description: Each pixel is coloured according to its NDWI value using the continuous 11-color brown-to-blue gradient. Brown pixels indicate dry soil or built-up areas. White/neutral pixels indicate the transition zone. Blue pixels indicate wet areas or open water. The site boundary polygon is overlaid. Users can switch between three sub-layers: standard NDWI (single period), NDWI range (annual mean), and NDWI delta (change between two periods).
How it's calculated: The map tile is generated from the Sentinel-2 pixel-wise mean composite for the selected period. Each pixel's NDWI value is mapped to a color from the 11-stop brown-to-blue gradient (range -1 to +1). Water masking is OFF — water pixels produce positive NDWI values and are shown on the map (unlike NDVI maps where water pixels are excluded).
Legend: Continuous gradient from dry to wet:
| Range | Color | Condition |
|---|---|---|
| -1.0 to -0.3 | ■ to ■ | Dry: bare soil, built-up, arid vegetation |
| -0.3 to 0.0 | ■ to ■ | Low to moderate moisture |
| 0.0 to 0.3 | ■ to ■ | Moist: wetlands, saturated vegetation |
| 0.3 to 1.0 | ■ to ■ | Open water: rivers, lakes, flooded areas |
Interpretation example:
If the map shows a dark blue strip along a river corridor surrounded by brown-wheat tones, the NDWI layer is correctly detecting the water body and the surrounding dry land — a typical pattern for a site that includes a stream or canal.
Maps > Land Use > "NDWI (range)" (Map Layer)
Map Layer. A map layer showing the average NDWI over a full annual period, computed as a pixel-wise mean of all valid cloud-free observations in the configured range.
Purpose: To represent the site's annual water content pattern rather than a single snapshot, reducing the effect of short-term events or cloud gaps.
Description: Same brown-to-blue color gradient as the standard NDWI layer. The range period is configurable in site settings. The map tooltip shows: "Average NDWI in the period {start} - {end}".
How it's calculated: All cloud-free Sentinel-2 images within the configured period are composited into a pixel-wise mean NDWI value.
Legend: Same 11-color continuous gradient as the standard NDWI layer (■ #8B4513 to ■ #00008B).
Interpretation example:
An annual range layer showing NDWI 0.15 across the site interior with blue values only along the north boundary confirms a mostly dry site with a permanent water feature on one edge — more reliable than a single-date snapshot.
Maps > Land Use > "NDWI (delta)" (Map Layer)
Map Layer. A map layer showing the pixel-wise difference in NDWI between two annual range composites, indicating change in water content over time.
Purpose: To identify where the site has become wetter, drier, or unchanged between two comparable periods.
Description: Pixels are coloured using a 9-color diverging gradient: dark red tones indicate water loss (site dried out), neutral/white indicates no change, dark blue tones indicate water gain (site became wetter). The tooltip shows: "Difference between average NDWI in the periods {x1}-{y1} and {x2}-{y2}".
How it's calculated: The delta is computed pixel-wise as (NDWI of final period) minus (NDWI of initial period). The result is calibrated to approximately -0.25 to +0.25.
Legend: Diverging gradient from ■ #8B0000 (strong water loss, delta approximately -0.25) through ■ #FFFAF0 (no change, delta = 0) to ■ #00008B (strong water gain, delta approximately +0.25).
Interpretation example:
If a delta layer shows a large dark-blue area where the previous period showed wheat/white tones, the site has experienced a significant increase in water content — potentially from a new water retention structure, restored wetland, or exceptionally high precipitation.
Data Sources
| Source | Provider | Coverage | Resolution | Period |
|---|---|---|---|---|
| ESA Sentinel-2 SR Harmonized | ESA / Copernicus | Global | 10 m (Band 3, Band 8) | April 2017 — present |
Detailed Methodology
All Sentinel-2 Level-2A images within the requested date range and site area are collected. Cloud and shadow pixels (identified via the Scene Classification Layer) are excluded. Water masking is OFF by default — unlike NDVI, water bodies are the signal of interest and must not be excluded. NDWI is calculated per pixel as the normalized difference between Green (Band 3) and NIR (Band 8) for each valid observation. A pixel-wise mean across all valid observations in the period produces the temporal composite. Min, max, and mean statistics are computed separately over the site (ROI) and the control area (CA).
Output resolution defaults to 15 m (not the native 10 m due to export configuration). For sites above 100 km² the resolution is auto-adjusted to 20 m, and for sites above 200 km² to 25 m.
Technical Notes
- NDWI map layers must be generated from Sentinel-2 imagery before KPI values can be computed; generation is triggered manually or on schedule from site settings
- The 3Bee platform implements McFeeters' NDWI (Green minus NIR), not Gao's NDWI (NIR minus SWIR). The two formulas target different aspects: McFeeters detects surface water; Gao targets vegetation liquid water. Xu (2006) proposed a Modified NDWI (MNDWI) using SWIR instead of NIR to reduce interference from built-up areas — this variant may perform better in dense urban sites
- Unlike NDVI, water masking is OFF by default — water pixels produce positive NDWI values and are included in spatial statistics, since detecting water is the primary purpose of the index
- Dense urban areas with high green-band reflectance may produce false-positive NDWI values similar to those of water bodies; interpret high values in urban contexts with caution
- Temporal composites computed over summer windows reduce the influence of seasonal flooding, revealing permanent water bodies; winter windows capture flood events
- In coastal or estuarine zones, mixed pixels at the land-water boundary can reduce classification accuracy
- Data availability begins from April 2017 (Sentinel-2 Level-2A archive start date); pre-2017 analysis is not available
- Related KPIs: NDVI (vegetation health), NDMI (vegetation moisture using SWIR), LST (land surface temperature), and Water Coverage (binary wetland/water body presence)
Bibliography
- McFeeters, S.K. (1996). "The use of the Normalized Difference Water Index (NDWI) in the delineation of open water features". International Journal of Remote Sensing, 17(7), 1425-1432. DOI: 10.1080/01431169608948714
- Xu, H. (2006). "Modification of normalised difference water index (NDWI) to enhance open water features in remotely sensed imagery". International Journal of Remote Sensing, 27(14), 3025-3033. DOI: 10.1080/01431160600589179
- Gao, B.C. (1996). "NDWI — A normalized difference water index for remote sensing of vegetation liquid water from space". Remote Sensing of Environment, 58(3), 257-266. DOI: 10.1016/S0034-4257(96)00067-3
- ESA Copernicus. (2021). Sentinel-2 User Handbook. European Space Agency. ESA Sentinel-2