Map Generator
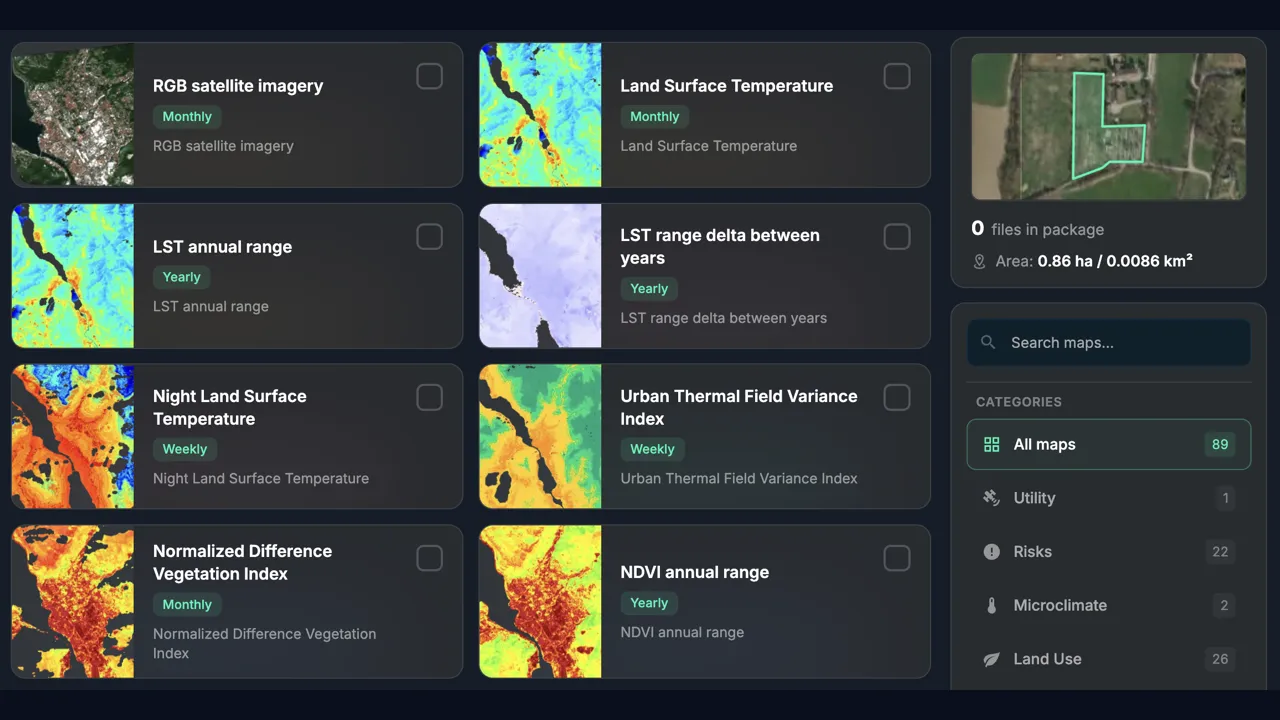
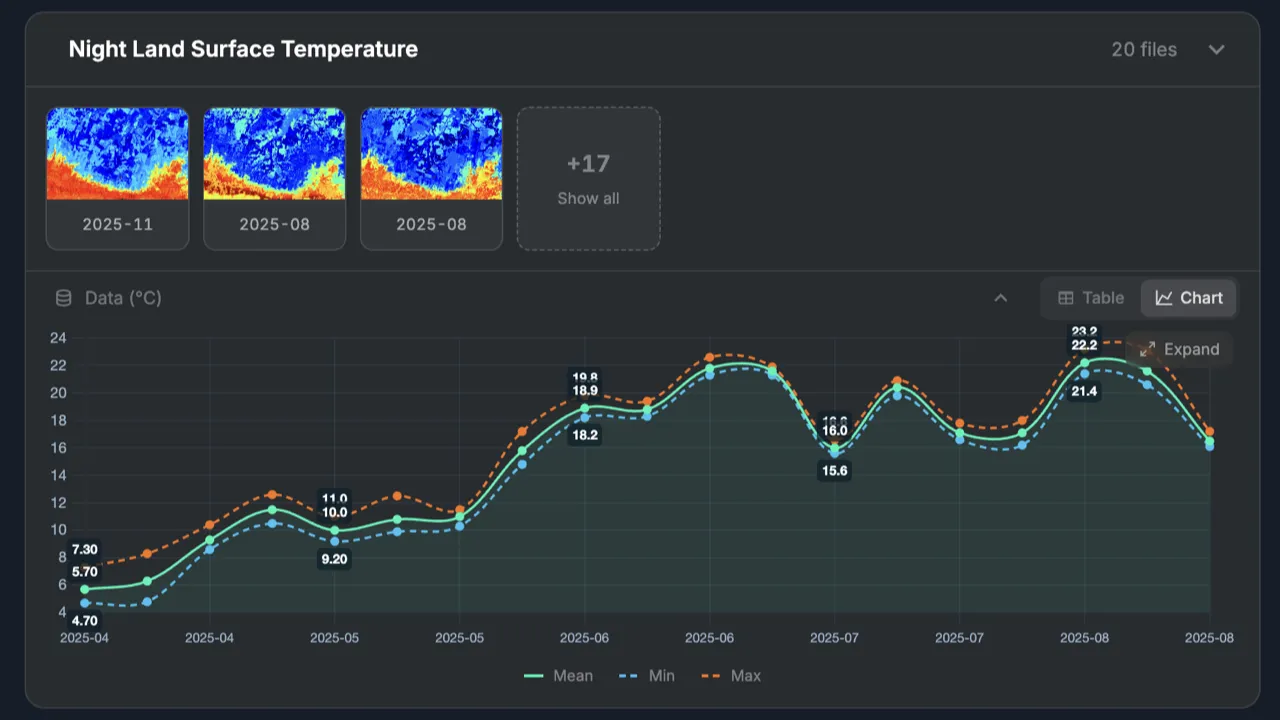
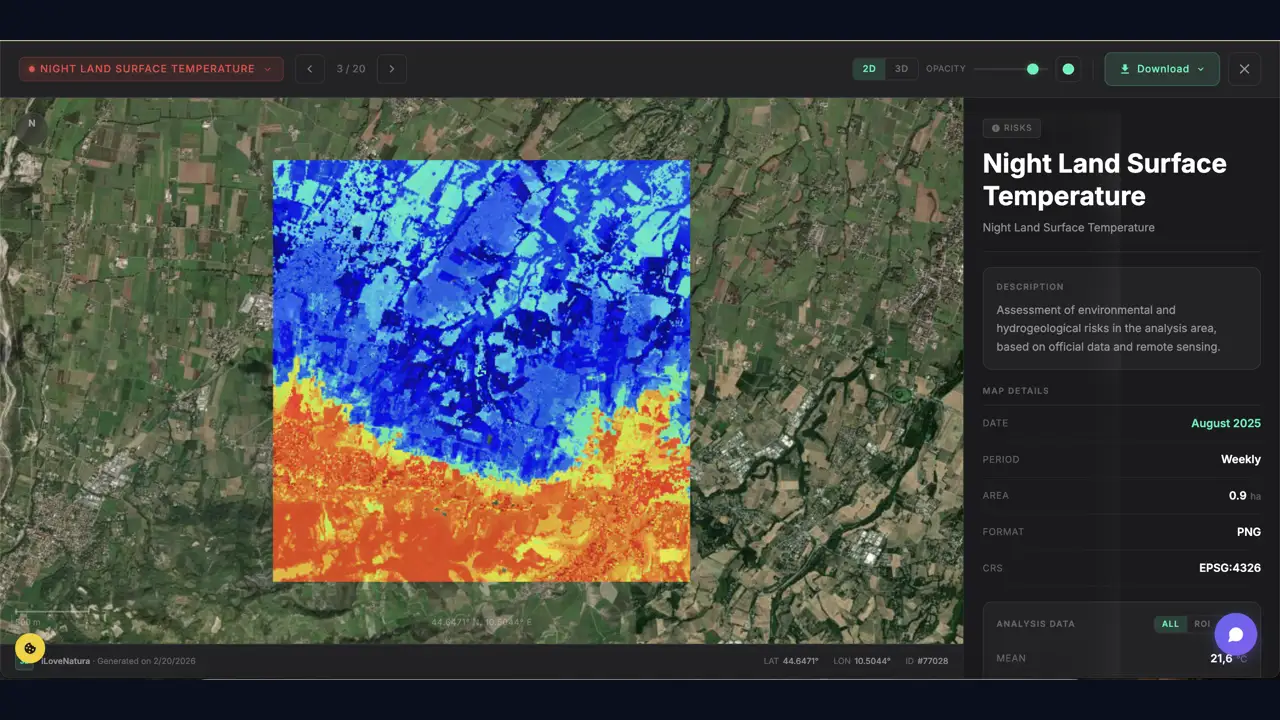
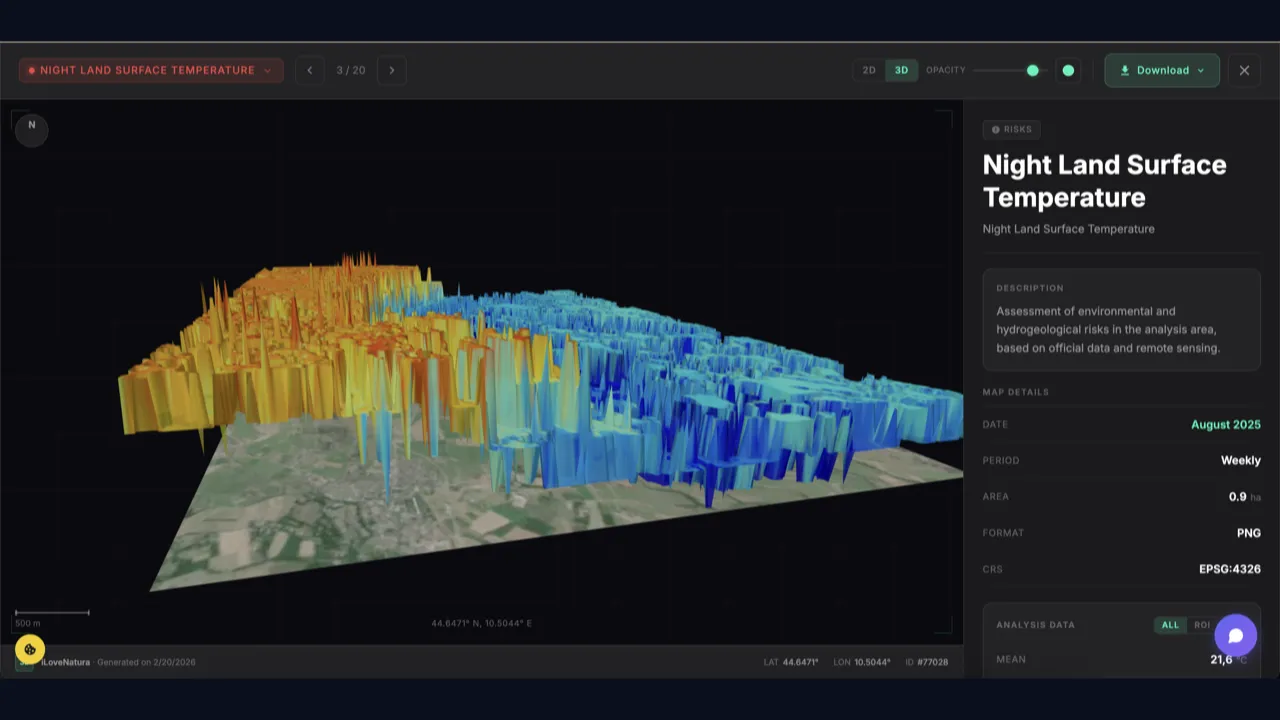
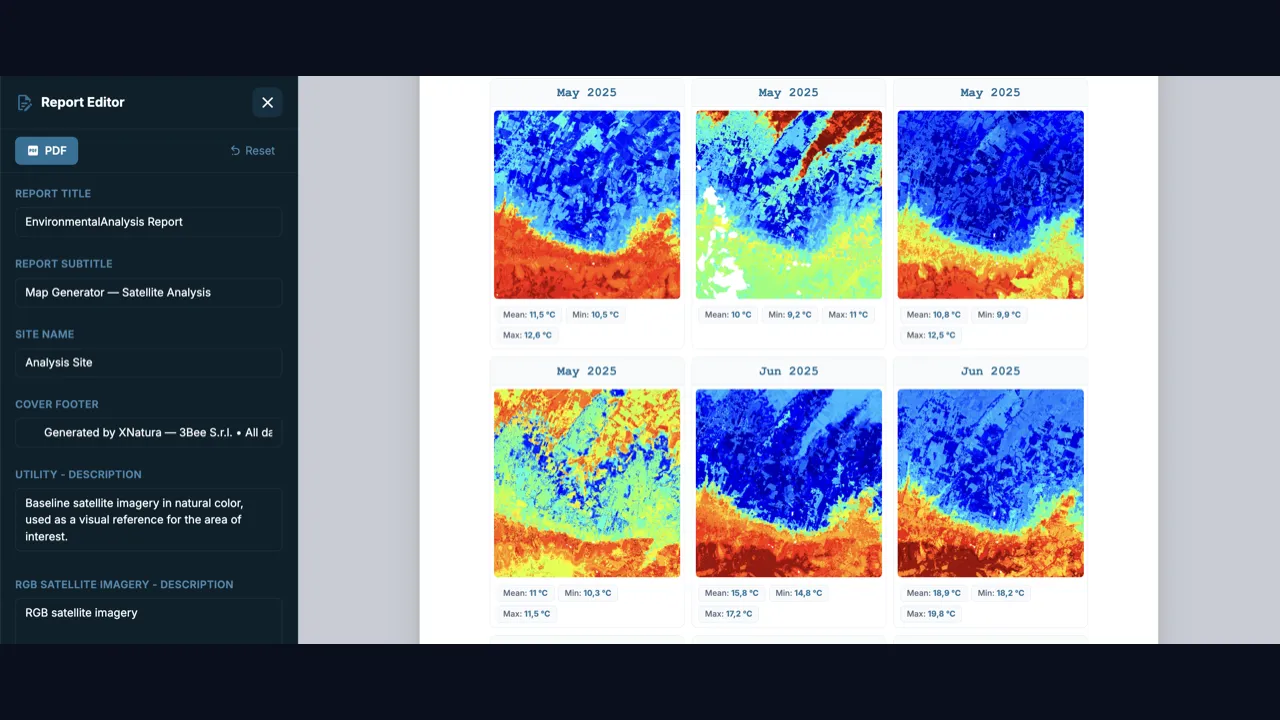
Generate professional environmental maps from 80+ Copernicus satellite layers organized in 12 categories -- utility, risks, microclimate, land use, urbanization, biodiversity, carbon, land cover, sensors, water, air quality, and socioeconomic. Define your area of interest by drawing a polygon on the interactive Leaflet map, searching any address with geocoding, or importing KML/GeoJSON files that are automatically parsed and merged into a single ROI. Select multiple map types from a filterable catalog with category sidebar and search, choose reference years (2017 to present) with a global year selector, and configure advanced parameters like delta year pairs for change-detection maps or custom date ranges for flood risk layers. The system creates a monitoring site, generates maps asynchronously via a bulk API with real-time progress tracking per layer, and delivers results grouped by category with color-coded badges. Preview any map on an interactive Leaflet overlay with satellite base layer, legend panel, KPI statistics (mean, min, max values extracted from metadata), heightmap 3D viewer, and pixel color identification on click. Download individual GeoTIFF files, batch-download all maps as a ZIP archive, or generate a professional report with AI-powered narratives, color-coded category pages, table of contents, site information, statistical summary, temporal comparison grids, and a customizable cover page -- exported as HTML (A4-printable), PDF, or DOCX via the built-in report template editor. Share results via link at no cost to recipients. Session state persists across page refreshes, and a sidebar shows recent analysis history with search, polygon version switching, and one-click result viewing.
Who Uses This Tool
Professionals who rely on this analysis
Environmental Consultant
Generate thematic maps across 12 categories for Environmental Impact Assessments, territorial monitoring reports, and client presentations. Download GeoTIFF data for GIS analysis in QGIS or ArcGIS, or produce professional PDF/DOCX reports with AI-powered narratives and territorial KPIs for regulatory submissions.
Urban Planner
Analyze land use change, vegetation health (NDVI), imperviousness, urbanization patterns, heat islands (LST/UTFVI), and socioeconomic layers for urban development plans, green infrastructure projects, and municipal reporting. Use delta year-pair maps to quantify temporal change.
ESG / Sustainability Manager
Create territorial analysis reports with satellite data across biodiversity, carbon, water, and air quality categories. Use PDF reports with environmental KPIs aligned with ESRS E4 and TNFD LEAP for CSRD sustainability disclosures and environmental due diligence documentation.
What you can do
See it in action
Map Generator
Map Generator
Map Generator
Map Generator
Map Generator
Video tutorial
A quick guide to learn how to use it in minutes
How it works
Define your area
Draw a polygon on the interactive satellite map with vertex snapping, search for any address using the geocoding search bar, or import a KML/GeoJSON file. Areas up to 20 hectares are available without registration; larger areas require a free account.
Select layers and years
Browse 80+ map types organized in 12 color-coded categories using the filterable catalog with search and category sidebar. Pick layers, select reference years with the global year selector (2017 to present), and configure delta year pairs or date ranges for specialized layers. A cost estimator shows credit usage before generation.
Generate maps
The system creates a monitoring site and generates all selected maps asynchronously via a bulk API. Track real-time progress per layer with estimated duration. Each map becomes available for download as soon as it completes -- no need to wait for the entire batch.
Preview, download, and report
Preview maps on an interactive overlay with legend, KPI statistics, and heightmap viewer. Download individual GeoTIFF files or a batch ZIP. Generate a professional PDF/HTML/DOCX report with AI narratives, category pages, and customizable cover. Share results via link at no cost to recipients.
Data Sources & Methodology
Maps are generated from European Space Agency (ESA) Copernicus satellite data and third-party geospatial datasets processed at high resolution. The platform offers 80+ layer types organized in 12 categories, each computed from calibrated and validated scientific products. Generation is performed asynchronously via a bulk API that supports annual, monthly, and weekly temporal resolutions.
Frequently Asked Questions
Answers to the most common questions about this tool
1What types of environmental maps can I generate?
The platform offers 80+ satellite layer types organized in 12 categories: utility (RGB true color, high-res RGB), land use (NDVI, NDWI, NDMI, soil erosion, soil carbon), risks (land surface temperature, urban heat islands), microclimate, urbanization (imperviousness, accessibility to cities), biodiversity (MSA, protected areas, tree cover, biodiversity intactness, human footprint), carbon (forest GHG flux, cumulative tree cover gain), land cover, sensors, water (plastic input in rivers, wetlands), air quality (PM2.5), and socioeconomic (GDP, GDP per capita). The full catalog with example images and descriptions is available on the layer selection page.
2How do I define the area to analyze?
Three methods are available. Draw a polygon directly on the interactive Leaflet map with vertex snapping for precision. Search for any address using the geocoding bar, which flies the map to the location. Or import a KML or GeoJSON file -- the system automatically parses it, merges multiple polygon features into a single ROI, and calculates the area in hectares. Without registration, areas are limited to 20 hectares; with a free account there is no hard limit, though areas above 1,800 hectares show a processing time warning.
3How does the generation process work?
The process has 3 steps. First, define your area (draw, search, or import). Second, browse the filterable catalog of 80+ map types organized in 12 categories, select layers, and pick reference years (2017 to present) using the global year selector -- some layers support delta year pairs for change detection or custom date ranges. Third, the system creates a monitoring site and generates maps asynchronously via a bulk API. You see real-time progress per layer with estimated duration, and can download each GeoTIFF as soon as it completes.
4What can I do with the results?
Preview any map on an interactive satellite overlay with a color legend panel, KPI statistics (mean, min, max values from metadata), and a heightmap 3D viewer. Click on the map to identify pixel values. Download individual GeoTIFF files for GIS software or batch-download all maps as a ZIP. Generate a professional report with AI narratives, color-coded category pages, table of contents, statistical summary, and a customizable cover page -- exportable as HTML (A4-printable), PDF, or DOCX via the built-in report editor.
5Is there a limit on the area size?
Without registration you can analyze areas up to 20 hectares. With a free account and credits, there is no enforced maximum. Areas over 1,800 hectares show a warning about longer processing times. Credit cost is proportional: per-km2 unit cost multiplied by the polygon area and number of files generated (monthly layers produce 12 files per year, weekly layers 52).
6How much does it cost to generate maps?
On signup you receive 10 free credits, no credit card required. Each map type has a per-km2 credit cost that varies by layer complexity. Monthly layers (12 images/year) and weekly layers (52 images/year) cost proportionally more. The category sidebar shows an estimated total credit cost before generation. PDF/HTML/DOCX report generation is always free and does not consume credits. Additional credit packages start from 19.90 EUR.
7Can I share results with colleagues?
Yes. Every analysis generates a shareable link that encodes the site and polygon IDs. Recipients can view all generated maps, preview them on the interactive overlay, and download reports at no credit cost. Your recent analysis history is accessible from the sidebar with search and one-click result viewing.
8Can I use the reports for CSRD/ESRS compliance?
Yes. Reports contain environmental KPIs derived from official Copernicus data (Sentinel-1, Sentinel-2, CLMS, ERA5) and Resource Watch datasets (WRI). AI narratives contextualize the data for sustainability disclosure. Metrics align with ESRS E4 (biodiversity and ecosystems) and the TNFD LEAP framework, making them suitable as supporting documentation for environmental due diligence and corporate sustainability reporting.
Free — start right away with your credits
Related tools
Explore other tools you might find useful
Fire Risk
Complete wildfire risk overview for a selected area: EFFIS structural index, VIIRS active fires, GDACS historical events and FWI climate scenarios (SSP1-SSP5). Includes AI summary, correlations with aridity and land cover, downloadable HTML reports and exportable social cards.
Comparative Temporal Satellite Maps
Compare satellite imagery across years or spectral indices with 8 layer types (RGB, NDVI, NDWI, NDMI, LST, Night LST, Light Pollution, UTFVI). Visualize changes in Grid, Swipe, Timeline, or Opacity mode.
Simple Web GIS Utils
Browser-based GIS toolkit: upload GeoJSON or KML files, apply spatial operations (buffer, union, simplify, dissolve, bbox, hull, centroid, split), and export results in GeoJSON, KML, or WKT format.
XN IRIS
iLoveNatura's flagship AI GIS: draw and analyze areas, manage layers (GeoJSON, KML, Shapefile, GeoPackage), run 9 geoprocessing operations, generate satellite and environmental maps, and chat with an AI assistant. Raster georeferencing, attributes table, measurement, version history, and multi-format export included.